Extract from the course What's New in Nuxeo Platform 2015 on Hyland University
Data Visualization support in Nuxeo leverages Web Components and the Polymer framework in order to allow users to easily build their own custom dashboards, thus helping them understand how data is distributed in the repository as well as monitoring workflow activity.
A set of custom elements are available for bootstrapping custom graphical dashboards. These elements are built using our Nuxeo Elements, in particular they rely on nuxeo-connection to configure the Nuxeo instance to use.
Technical Overview
Extract from the course What's New in Nuxeo Platform 2015 on Hyland University
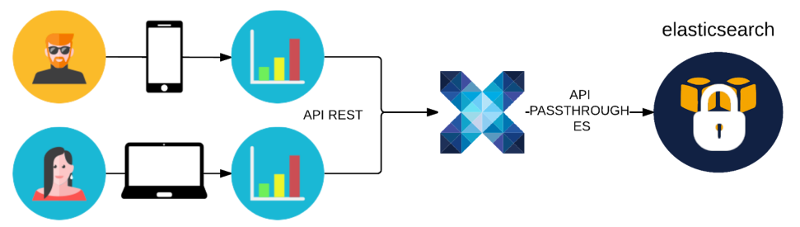
Elasticsearch Passthrough
Since Nuxeo 7.4, the platform provides an Elasticsearch Passthrough that allows using the HTTP REST API provided by the Elasticsearch back end. This API provides a comprehensive and powerful search DSL based on JSON to define queries which we can leverage to execute advanced aggregated searches.
These aggregations provide analytic information over a set of documents and allow us to build complex search requests which can provide computed metrics over this set of documents through filtering and "bucketing".
For more information about Elasticsearch's Search DSL you can take a look at its online documentation.
Data Visualization Elements
Non visual elements are the standard way to expose remote services while sticking to Polymer's “everything is an element” metaphor so we created a set of custom elements to query data from Elasticsearch. The goal is to hide complexity from the user by providing a simple, concise declarative way to build complex queries which cover most use cases.
Like what has been done for our core Nuxeo Elements focus was on a clear separation between data and the graphical elements to allow users to use existing UI elements for building their own custom dashboards.
GitHub project: https://github.com/nuxeo/nuxeo-dataviz-elements
Online reference documentation: http://nuxeo.github.io/nuxeo-dataviz-elements
Workflow Data
Extract from the course What's New in Nuxeo Platform 2015 on Hyland University
The Workflow Data element (nuxeo-workflow-data) allows querying Nuxeo's Workflow Audit Log which, since Nuxeo 7.3, is stored by default as an Elasticsearch index.
It allows users to retrieve data from this index by defining a set of attributes in this custom element which provide a simple and fluent syntax to build complex aggregate searches.
Under the hood each query is built as a nested aggregation with a fixed number of aggregation types and levels. The final query structure is fully configurable by the set of optional attributes available in our element:
grouped-by: Top level term aggregations (comma-separated values)
with-*: Nested multi-bucket aggregation (
with-ranges|with-date-intervals)metrics: leaf single-value metrics aggregation (max, min, avg, sum)
For example, by using our nuxeo-workflow-data element with the following attributes:
<nuxeo-workflow-data workflow="worflowModelName"
                     grouped-by="action"
                     with-ranges='{
                      "duration":[
                         {"key":"quick", "to":"1500"},
                         {"key":"slow", "from":"1500"}
                       ]}'
                     metrics="sum(amount)"
                     data="{{data}}">
</nuxeo-workflow-data>
Our element would produce a request like this:
{
  query: { bool: { must: [...] },
  aggs: {
    by: { // aggregated-on
      terms: {
        field: "extended.action"
      },
      aggs: {
        by: {  // with-ranges | with-date-intervals
          range : {
            field : "extended.duration",
            ranges: [...]
          },
          aggs: {
            metric: { // metric
              sum: {
                field : "extended.workflowVariables.amount"
              }
            }
          }
        }
      }
    }
  }
}
By building a custom element to help users query the Workflow Audit Log, we not only provide a simpler more fluent declarative syntax, but we can also decouple from Elasticsearch's specificities in most use cases.
Data returned from Elasticsearch is also processed for simplification and consists of either a single scalar value, for non aggregate queries, or a nested list of {key: key, value: value} entries where value can itself be a similar list or single scalar value.
Note: Before using this data for producing tables or charts it usually must undergo another transformation process which is specific to the charting and table elements used. For sample transformation helpers we recommend looking at existing dashboards which showcase integration with third-party libraries.
Building Custom Dashboards
Before building your own custom dashboards please make sure you fulfill the requirements in the Nuxeo Elements Quickstart page.
The quickest way to start building a dashboard is to use the Yeoman generator to scaffold our custom elements.
Generate a
nuxeo-sampledashboard element:mkdir -p nuxeo-sample-dashboard && cd $_ yo polymer:seed nuxeo-sample-dashboardNote: It is a good practice to build dashboards as custom elements since you can then use them anywhere you see fit. But you can also build dashboards as full applications in which case the Yeoman polymer application generator should be used instead.
Once the
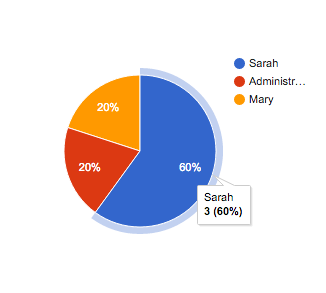
nuxeo-sampleelement is generated you can install further client side dependencies. In this case you need the Nuxeo Data Visualization Elements and a charting library to produce charts for your dashboard:bower install --save nuxeo/nuxeo-dataviz-elements bower install --save GoogleWebComponents/google-chartYeoman scaffolded a sample custom element so you now need to replace this sample content with your own. In this example build a simple chart with the total number of Serial Review workflows started by each user:
nuxeo-dataviz-sample.html<dom-module id="nuxeo-dataviz-sample"> <template> <!-- Retrieve our data and store it in 'initiators' --> <nuxeo-workflow-data workflow="SerialDocumentReview" event="afterWorkflowStarted" grouped-by="workflowInitiator" start-date="[[startDate]]" end-date="[[endDate]]" data="{{initiators}}"> </nuxeo-workflow-data> <!-- Display a Pie Chart with out data --> <google-chart type="pie" cols='[{"label": "User", "type": "string"},{"label": "Value", "type": "number"}]' rows="[[_rows(initiators)]]"> </google-chart> </template> </dom-module> <script> Polymer({ is: 'nuxeo-dataviz-sample', // Expose startDate and endDate as properties properties: { startDate: String, endDate: String }, // Transform our data for usage with Google Charts _rows: function(data) { return data.map(function(e) { return [e.key, e.value]; }); } }); </script>Each Polymer element usually includes a usage demo which you can edit to see and showcase your custom element in action:
demo/index.html<html> <head> ... <link rel="import" href="../../nuxeo-elements/nuxeo-connection.html"> <link rel="import" href="../nuxeo-dataviz-sample.html"> </head> <body unresolved> <!-- Define a connection to our Nuxeo server --> <nuxeo-connection url="http://localhost:8080/nuxeo" username="Administrator" password="Administrator"></nuxeo-connection> <!-- Include our element and specify a start and end date --> <nuxeo-dataviz-sample start-date="2015-09-01" end-date="2015-10-30"></nuxeo-dataviz-sample> </body> </html>To checkout your element we recommend using Polyserve, a simple web server for using bower components locally, which you can install with:
npm install -g polyserve
polyserve -p 3000
Once Polyserve is up and running we can finally see our custom element's demo at: http://localhost:3000/components/nuxeo-dataviz-sample/demo/
Sample Dashboards
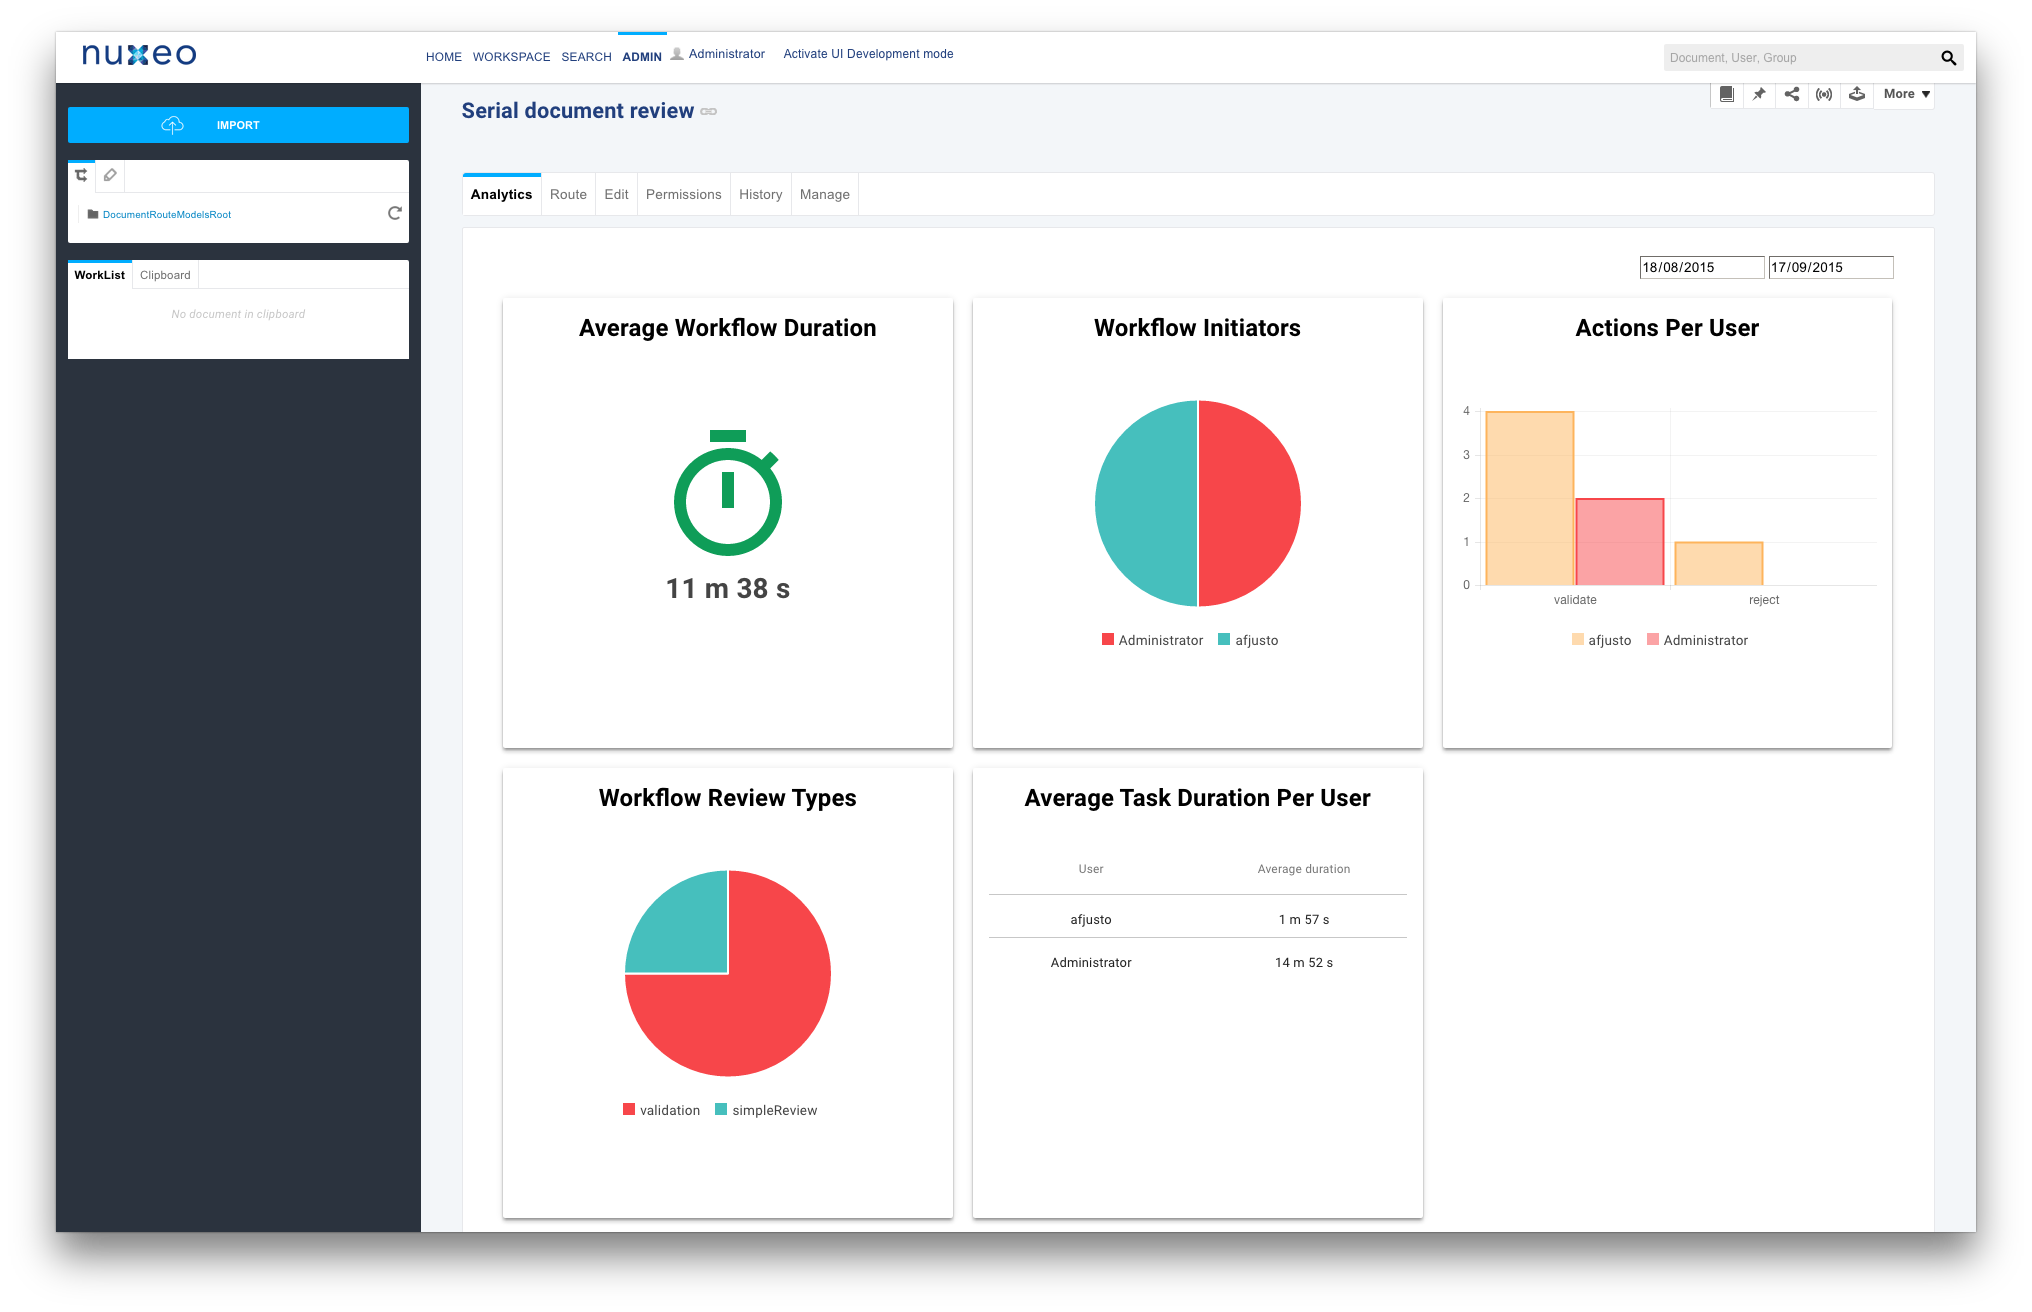
Review Workflows Dashboards
GitHub project: https://github.com/nuxeo/nuxeo-review-workflows-dashboards
Serial Review Dashboard: https://github.com/nuxeo/nuxeo-review-workflows-dashboards/blob/release-7.10/src/main/elements/nx-workflow-dashboard/nx-serial-workflow-dashboard.html
Parallel Review Dashboard: https://github.com/nuxeo/nuxeo-review-workflows-dashboards/blob/release-7.10/src/main/elements/nx-workflow-dashboard/nx-parallel-workflow-dashboard.html
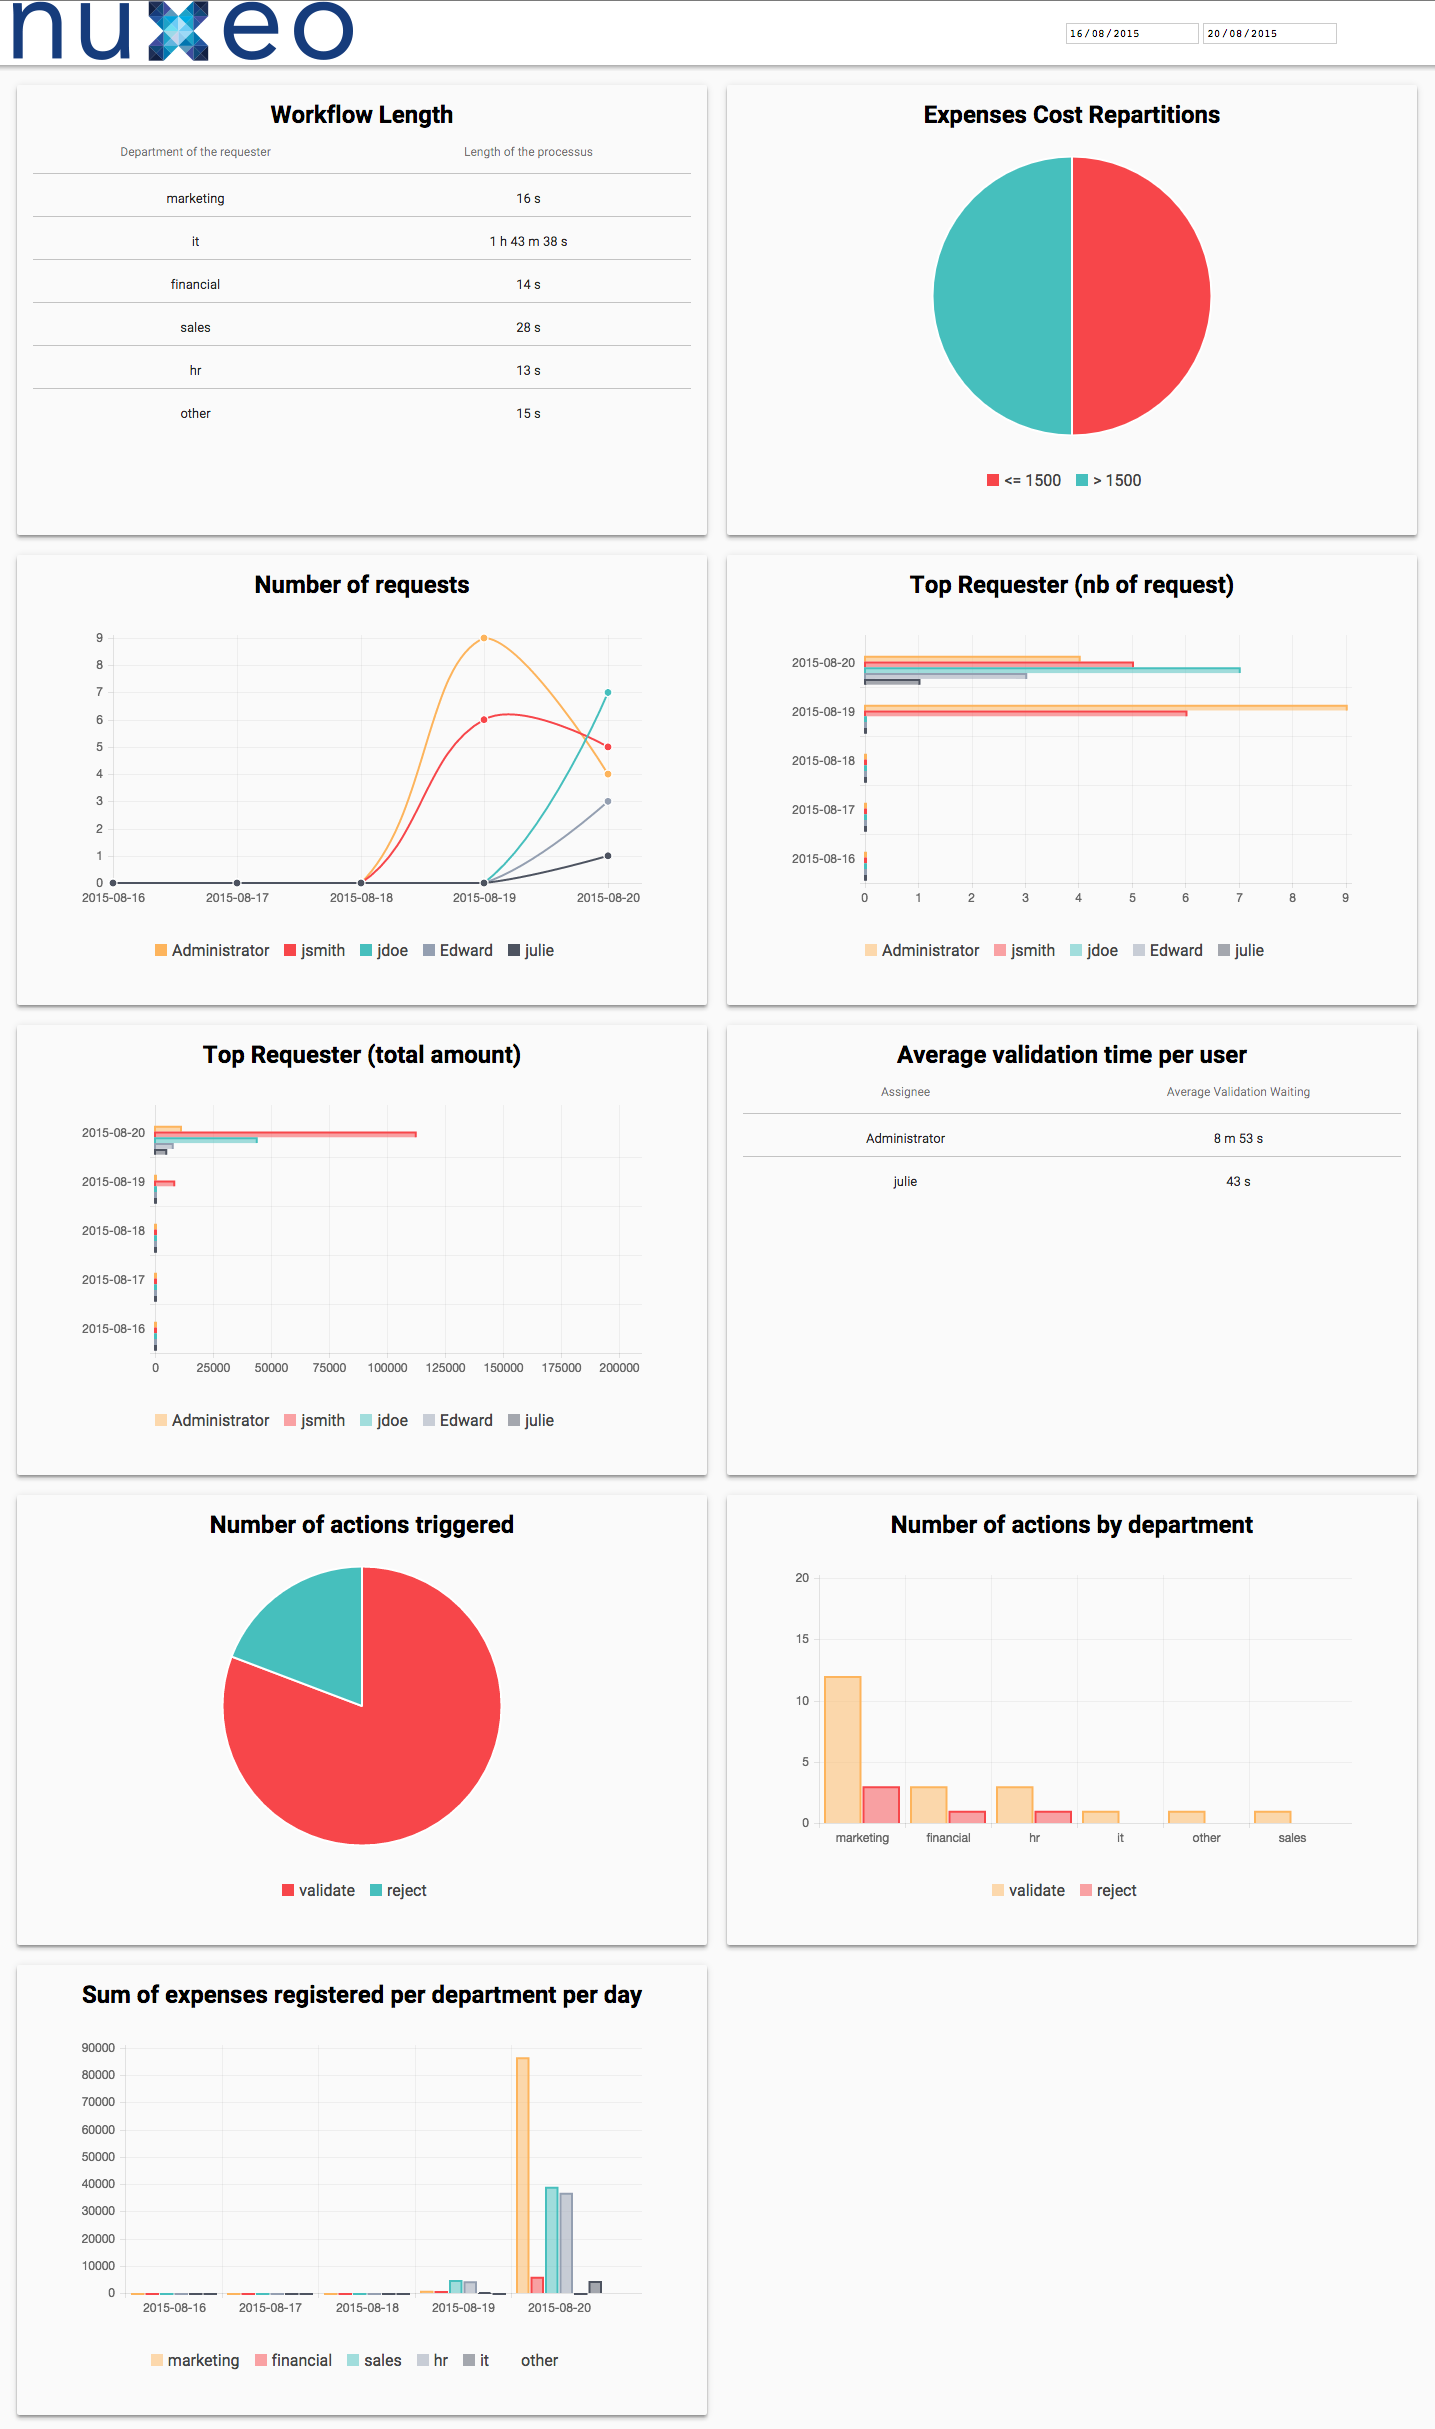
Travel Expenses Sample Dashboard
GitHub project: https://github.com/nuxeo/nuxeo-travel-expenses