Reporting with Kibana is superseded by the Data Visualization module from LTS 2015.
We have added support for Elasticsearch to the Nuxeo Platform since version LTS 2014 (6.0), bring it greater scalability. We use it to index all the documents in your instance. The results outside of the scalability enhancements is a much better response time when browsing Nuxeo. One of the other benefits of this integration is that we now have an easy to use reporting solution with Kibana.
Documentation will give you examples of how to setup and use it.
Installing Kibana 4
Kibana 4 requires to access directly the Elasticsearch database used by Nuxeo, and also requests to be protected (so, installed on an AWS instance for example, no hacker can access it).
Everything is explained in details here: https://github.com/nuxeo-sandbox/nuxeo-kibana4-demo
Some thoughts:
- All this protocol is for an installation on a Linux box (tested and checked on AWS instances)
- Never done it on Windows, nor on Mac
- If your are doing your demos on your localhost, maybe you can skip the creation of the "kibana" user, etc.)
For development and quick test purposes, you can also install Kibana and Nuxeo on your computer and allow Kibana to access the embedded Elasticsearch. See the last section Settings.
Recommendations
When opening Kibana 4, the "No results found" page is probably displayed by default. This is because the analysis period is set to "Last 15 Minutes" by default (which is probably cool when analyzing the server metrics), so change it (top-right item of the page)
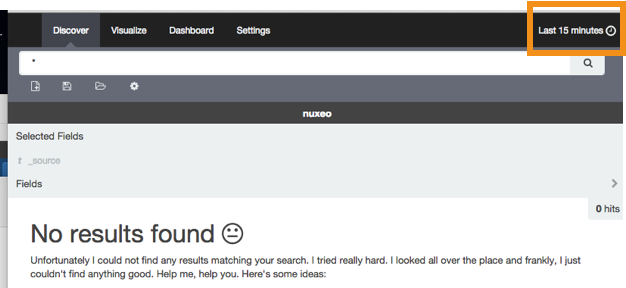

Also, Kibana evolves at light speed, so some of the screenshots you'll find here may already be obsolete. For example, it is likely that the search interval will be saved by Kibana in future small releases, because it is something that, practically speaking, annoys everybody.
Main Principles
There are basically three steps:
- Create and save a Search
- Create and save 1-n _Visualization_s (Pie Chart, Bars, ...) based on this search
- Add the visualization(s) to a Dashboard (and save it)
Saving a search is useful when you want to display different vizualizations for the same search. For example, you could have:
- A search that finds all "Picture" documents
- And several visualizations based on this search: One using the lifecycle state, one using a field (dc:nature, ...), etc.
Still, you can create a new visualization with a search that will be used only by this visualization. In this chapter, we describe the use of a saved search.
Creating and Saving a Search
Make sure you have the index pattern you want to use (nuxeoand/oraudit): Go to "Settings" (top menu)
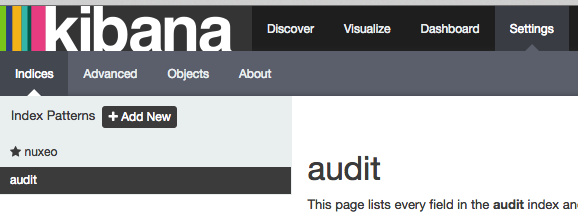

If you don't see the index you need, you must add it:
- In the Indices sub tab, click the "+ Add New" button
- In "Index name or pattern" enter an existing indice: Either
nuxeooraudit - Once the name of the indice is entered, you must select a "Time-field name"
- We generally select
dc:modifiedfornuxeo - And
eventDatefor theaudit
- We generally select
Go to "Discover" in the top menu, and click the "New Search" button


Then, click on the "Settings" button


Depending on the sub-version of Kibana, you may not have this "Settings" button: The index pattern to select is then just on the left, at the top of the list of fields:
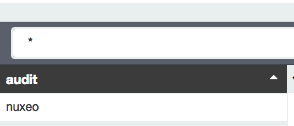

In Index Pattern, select your index (nuxeo or audit). You can now create a search:
- Enter the search statement
- WARNING: This is Lucene syntax, so basically:
:is the equals sign- Which means
:in Nuxeo's fields path (schema:field) must be escaped
- Example: Search all documents of type "Picture":
ecm\:primaryType: "Picture"
- Run (to check you find something)
- Save the search
- WARNING: This is Lucene syntax, so basically:
Creating and Saving 1-n Visualizations Based on This Search
Select Visualization in the top menu. In Create a new visualization, select the kind of visualization you want. In the next step ("Select a search source"), select "From a saved search" and select the search you saved previously.
This is where step #1 is not always required. You could use "From a new search", select an index, then enter a query statement.
Now, set up your visualization (See the example(s) below). Click "Save" and give a name to this visualization.
Adding the Visualization(s) to a Dashboard
Go to Dashboard. If you already had a dashboard, you can either:
- Click the "+" toolbar button (on the right)
- Or the "New Dashboard" button
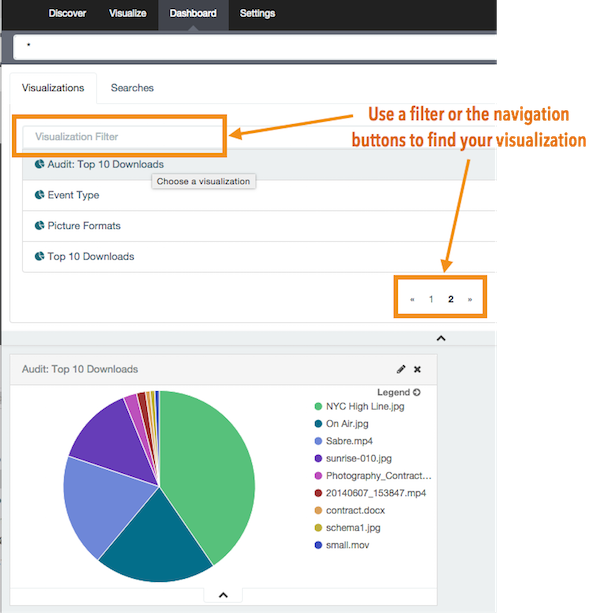
In all cases, you can use the "+" button and add the visualization you saved
Example: Pie Chart On "Top 10 Downloads"
This example is using the "audit" index (not "nuxeo")
Creating and Saving a Search
Select Discover in the top menu, click on the New Search button. In the Index pattern, select Audit
In the search field, enter the following expression:
extended.downloadReason:"download" AND NOT extended.[blobFilename:storyboard-0*](http://blobfilenamestoryboard-0%2A/)With current version of Nuxeo (7.3), the audit logs as "download" a lot of things that are actually not a real download. For example, when displaying a video, there is a download entry for each picture of the storyboard. On the other hand, displaying thumbnails is filtered (thumbnail event in the log, displaying the preview of a picture too, ...)
- Save this search: "Audit: Downloads"
Creating and Saving 1-n Visualizations Based on This Search
- Select "Visualization" in the top menu
- In "Create a new visualization", select "Pie Chart"
- In the next step ("Select a search source"), select "From a saved search" and select the search you saved previously ("Audit: Downloads")
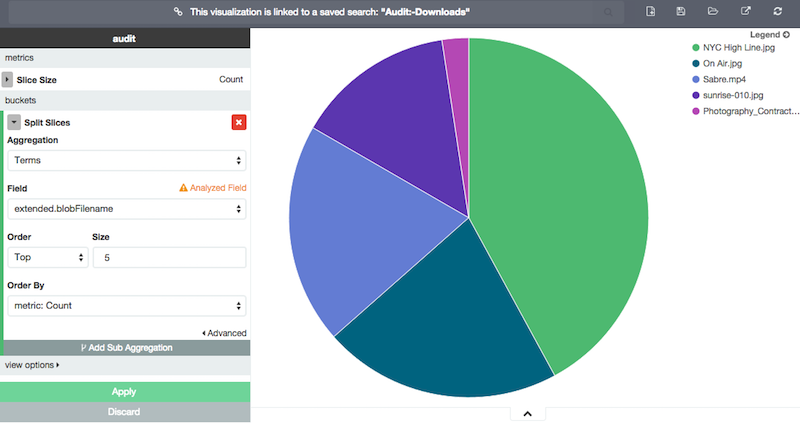
- Now, set up your visualization
- Click "Split Slices" (below "Select buckets type")
- In "Aggregation", select "Terms"
- Field: extended.blobFilename
- Order: Top
- Size: 10
- Click "Apply" to check all is good
- Click "Save" and give a name to this visualization: "Audit: Top 10 Downloads"
Here it is:

Adding the Visualization(s) to a Dashboard
Go to Dashboard, if you already had a dashboard, you can either
- Click the "+" toolbar button (on the right)
- Or the "New Dashboard" button
In all cases, you can use the "+" button and add the visualization you saved. Possibly, add other visualizations. Once it's done, save your Dashboard, so you can reuse it for a demo.
Tada!

Setting up Kibana 4 on Mac
This will explain how to run Kibana 4 with a Nuxeo running on localhost on your Mac.
We will allow the embedded Elasticsearch to answer any HTTP request on port 9200. This is not secure:
- But it's ok when using it only on your Mac with localhost,
- Don't do that on a public VM, it is a security problem,
- (And don't allow your Mac to answer requests from the outside :wink:)
Settings
- Download Kibana 4
- Just the final application (no need to build or do some command line scripts. Just download the binaries)
- Go to https://www.elastic.co/downloads/kibana, find the Mac OS version, download it
- At the time of this writing (2015-08-24), we downloaded kibana-4.1.1-darwin-x64.tar-2.gz
- Extract kibana-4.1.1-darwin-x64.tar-2.gz
- You now have the "kibana-4.1.1-darwin-x64" folder
- You can leave the default values
- Just in case if you are stressed you can check kibana-4.1.1-darwin-x64/config/kibana.yml
- It must listen on port 5601, and server "0.0.0.0".
- If you change that or if a future version of Kibana changes that, you'll adapt (see below)
Have a nuxeo-tomcat and change its nuxeo.conf file
- {path/to/nuxeo}/bin/nuxeo.conf
- Uncomment the line elasticsearch.httpEnabled=true
So basically, you now have:
. . .
elasticsearch.httpEnabled=true
. . .
Nuxeo FastTrack 7.4Since Nuxeo FastTrack 7.4, this option is enabled by default, just check it is there
- Start nuxeo
Start Kibana:
Command:
cd /path/to/kibana-4.1.1-darwin-x64/bin
./kibana
The terminal must ends with a line telling you Kibana is listening ("Listening on 0.0.0.0:5601")
- Test it's ok:
- In another terminal, curl localhost:5601 must return something valid (not a connection error)
It's ok, you are all setup. When done with this, do not forget to quit Nuxeo and Kibana.