Metrics
The platform uses Coda Hale Yammer Metrics.
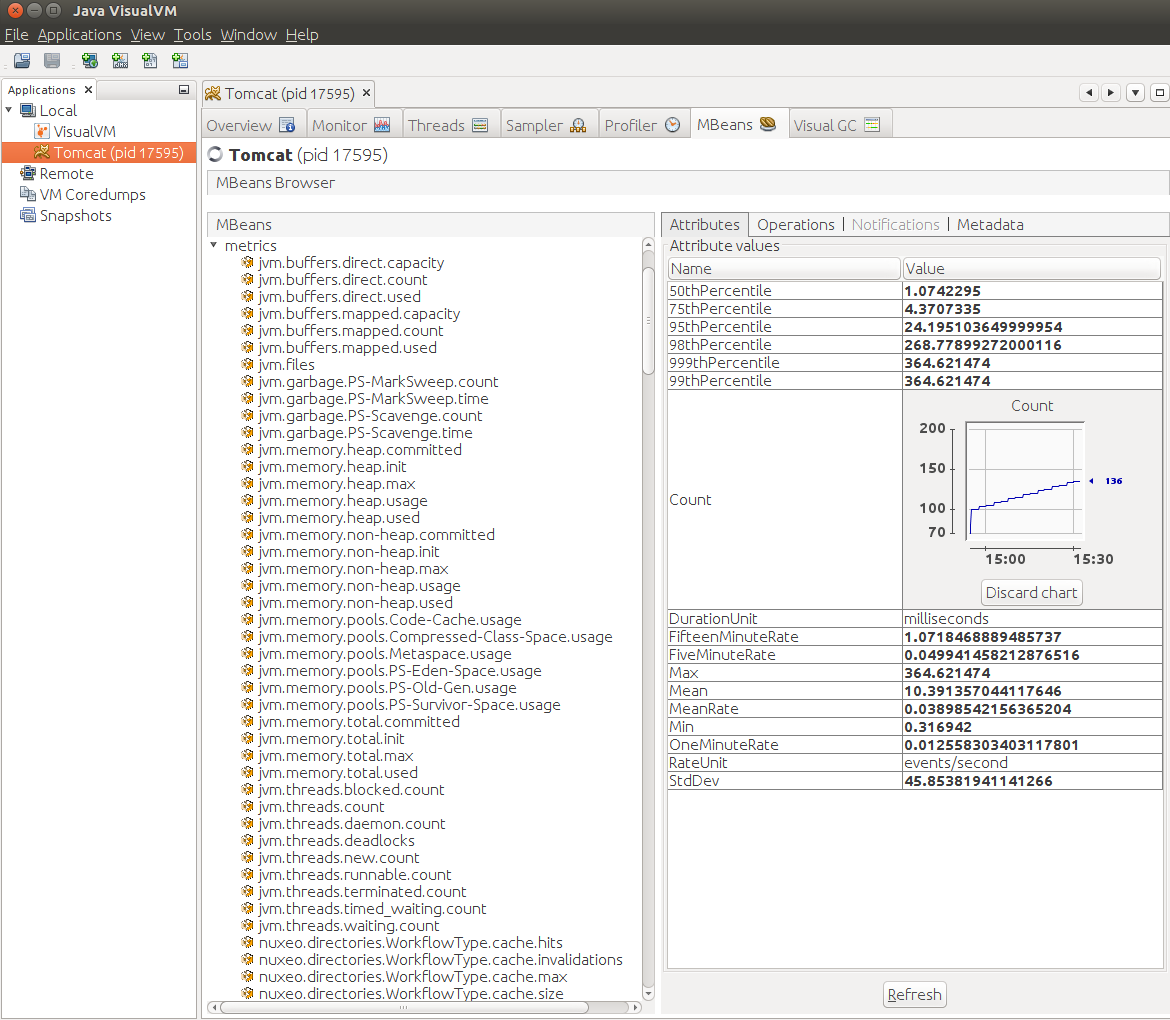
These metrics are exposed via JMX but can also be reported with CSV files or send to a Graphite server.
Reporting Metrics
Enabling JMX Reporting
To enable JMX reporting add the following to the nuxeo.conf file:
JAVA_OPTS=$JAVA_OPTS -Dcom.sun.management.jmxremote=true
You then have to manage security for this access, since there is no authentication by default.
Enabling CSV reporting
metrics.csv.enabled=true
metrics.csv.period=10
# This will create a sub directory metrics-TIMESTAMP
metrics.csv.dir=${nuxeo.log.dir}
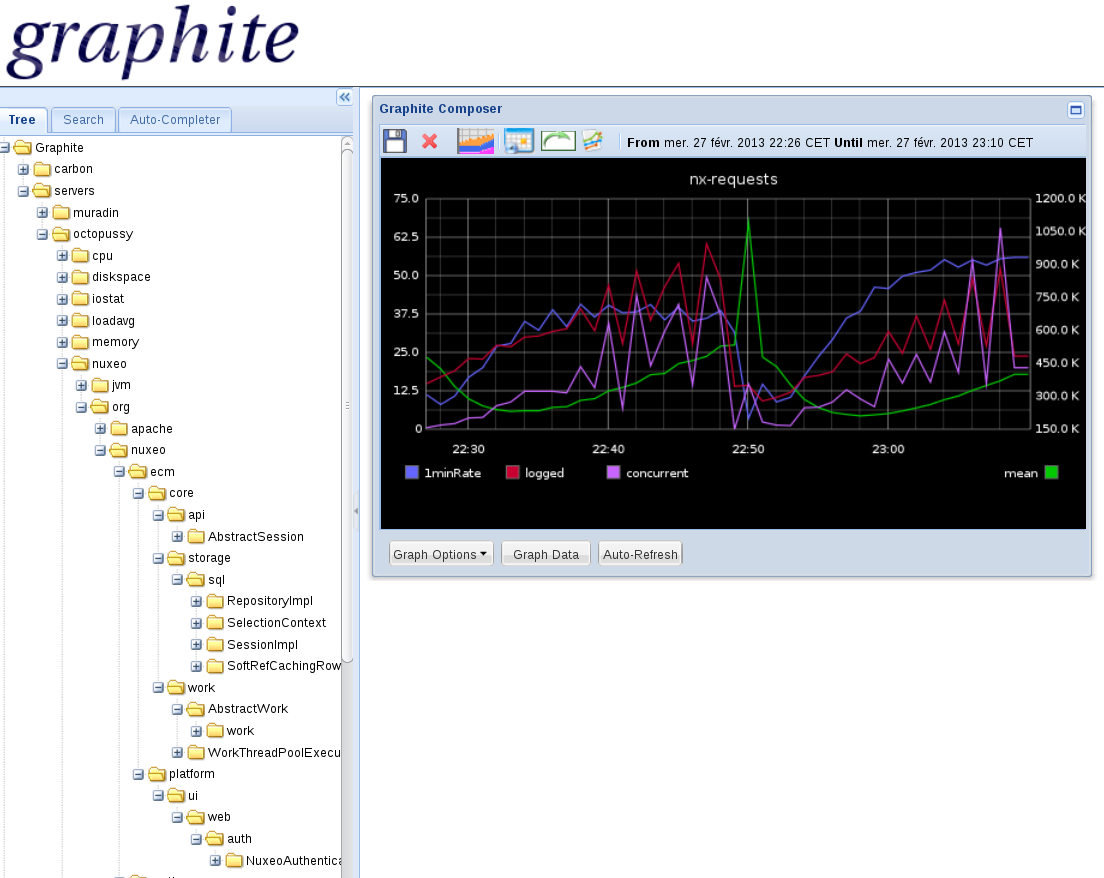
Enabling Graphite reporting
metrics.graphite.enabled=true
metrics.graphite.host=localhost
metrics.graphite.port=2003
metrics.graphite.period=10
Reporting log4j stats
metrics.log4j.enabled=true
Reporting tomcat JMX info:
metrics.tomcat.enabled=true
Note that period to report metrics are in second.
Nuxeo Metrics
Metrics are prefixed when exposed to graphite, the default prefix is servers.${HOSTNAME}.nuxeo to be compliant with Diamond prefix,
this can be changed by setting the metrics.graphite.prefix in nuxeo.conf.
For instance the counter for document creation named nuxeo.repositories.default.documents.create is exposed:
- in graphite with the name
servers.myhostname.nuxeo.nuxeo.repositories.default.documents.create.count - in JMX with a mbean named:
metrics:name=nuxeo.repositories.default.documents.create
Here is a short list of Nuxeo metrics:
- nuxeo.repositories.default.documents
- create: Counter of document created
- delete: Counter of document deleted
- update: Counter of document updated
- nuxeo.repositories.jdbc/nuxeo.connections
- count: VCS connection count
- idle: VCS idle connection count
- nuxeo.transactions.concurrents
- count: Counter for concurrent transaction
- max: Maximum value of the previous counter
- nuxeo.transactions.duration: Timer for transactions
- nuxeo.transactions.rollbacks: Counter for transactions in failure
- nuxeo.works.<WORKER_POOL>:
- completed: Counter for completed jobs
- running: Counter of running jobs
- scheduled.count: Counter of job waiting to be processed
- scheduled.max: Maximum scheduled jobs
- total: Timer for the job duration
- nuxeo.elasticsearch.service
- bulkIndex: Timer for bulk index operations
- index: Timer for index operations
- delete: Timer for deletion operations
- search: Timer on search operations
- fetch: Measure the time to retrieve documents
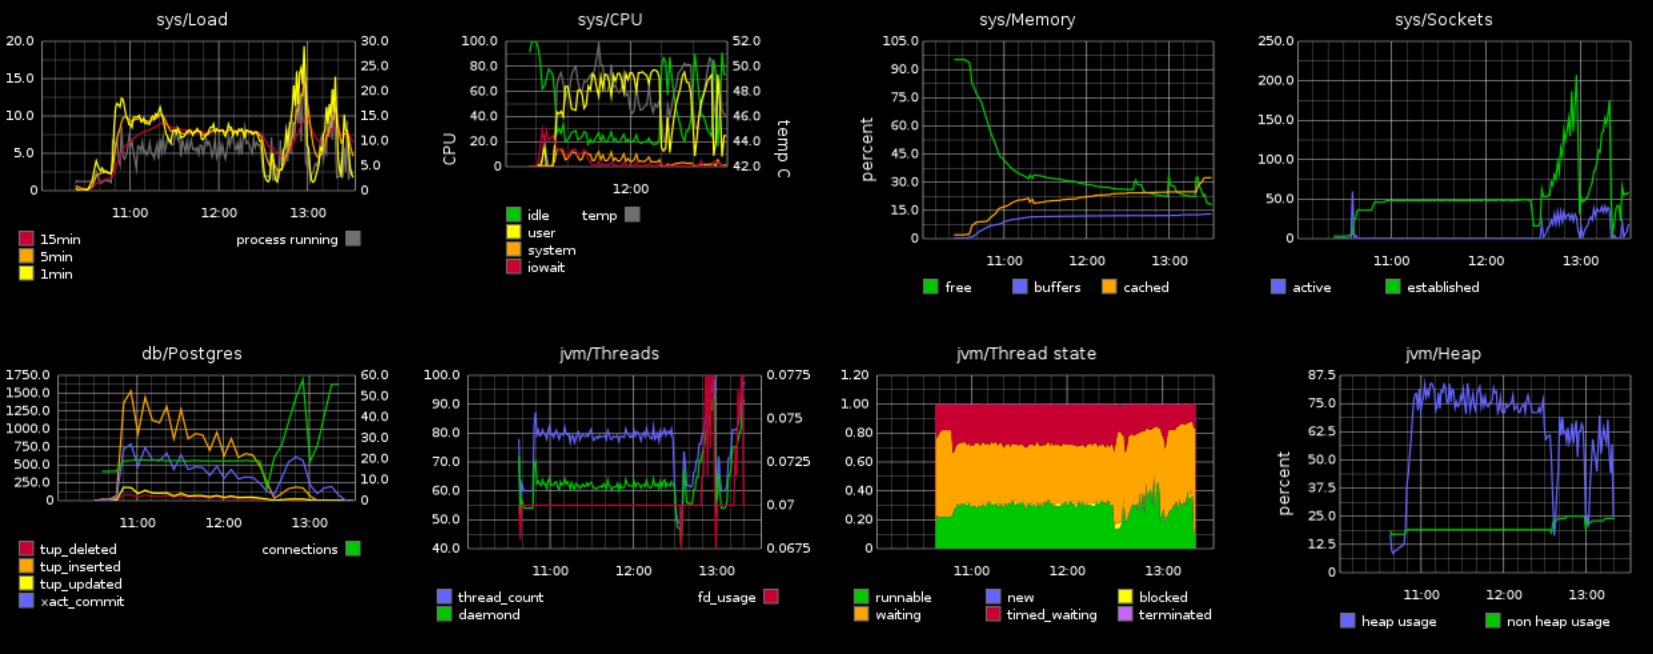
The Graphite reporter also include JVM metrics for GC, memory and thread pool.
See the reporting problem JMX monitoring to list all of the available metrics.
You should also monitor the system and the database to have a complete monitoring, tools like Diamond can do this easily.
Graphite Dashboard
You can find an example of Graphite dashboard on GitHub: https://github.com/nuxeo/nuxeo-runtime/blob/release-6.0/nuxeo-runtime-metrics/graphite/dashboard.json.
You will have to edit the dashboard to replace the hostname (here it is octopussy).
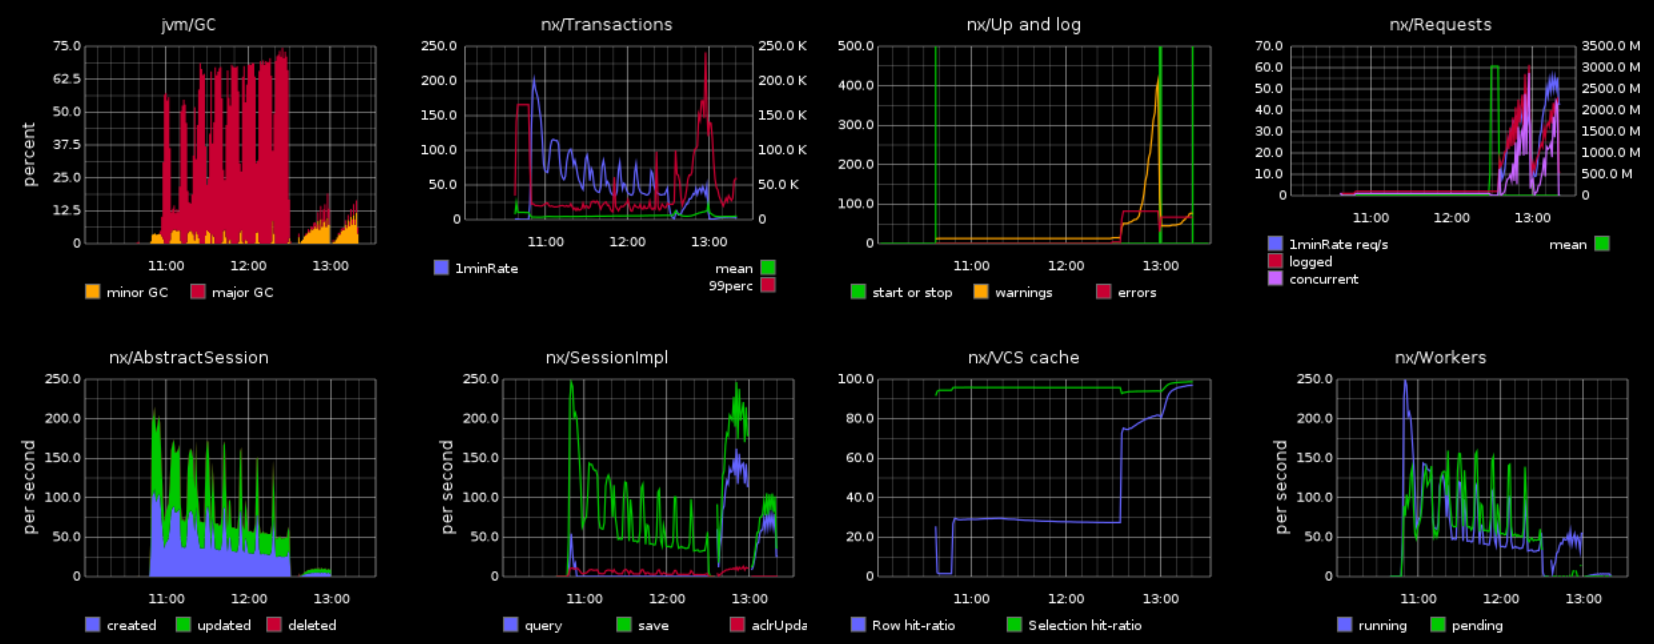
Here is an extract of what this dashboard looks like when monitoring a daily bench.
Monitoring
The Nuxeo Platform also comes with a set of default probes and administrative statuses for monitoring, that are provided by the component Nuxeo Core Management. Both can be seen and managed from JMX and from Admin Center.
Administrative Status
An administrative Status is a way to define cluster-wide or instance-wide named variables that can be used to manage the status of a running platform:
- turn on/off a node of the cluster,
- display a message to all users of the platform,
- ...
By default only three statuses are defined:
nuxeoInstance: indicates if a Nuxeo instance (cluster node) is active of not,adminMessage: message to be displayed to all users,smtpService: defines if SMTP gateway can be used.
Administrative Status can be configured and declared via the serviceDefinition extension point.
Probes
Probes can be used to run a test on the target deployed platform. Probes can be used to check that all part of the architecture are actually running for real:
- check LDAP access,
- check instance availability,
- check VCS access,
- ...
Probes can be defined via the probes extension point.
By default four probes are defined:
adminStatus: checks local instance enable flag (checksnuxeoInstanceadminsitrative status),activeRepositorySession: returns the number of active sessions per repository,ldapDirectory: check LDAP connectivity,remoteSQLStorageSession: number of remove VCS client connected (only used in VCS client/server mode that is not enabled by default).
Monitoring Using JMX Access
You can use JVisualVM or similar tool to access Nuxeo JMX interface. See the section Enabling JMX Access.
Monitoring Using the Admin Center
Inside the Admin Center there are two sections that are related to monitoring: Activity and Monitoring
Activity
The Activity section provides access to:
a Users sessions tab that displays counters for the web UI access:
- Total number of active HTTP sessions: The number of user active user session on the UI
- Total number of HTTP requests: The number of requests for page and dynamic resources served by JSF/faces
- List active sessions within a duration
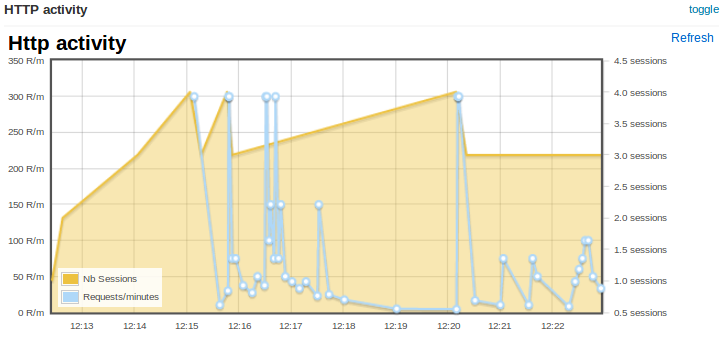
- A view that displays HTTP counters (requests and sessions)
- A view on audit logs
- Activity charts based on web and repository counters
Monitoring
The Monitoring sections provides access to:
- A view on Administrative Status (view / edit)
- A view on probes (view/run)
- A view that allows to enable Event Listener statistic gathering
REST Access
Counters
Counter are exposed via Automation API Counters.GET
This API is used inside the Admin Center to be able to generate the small graphs with an OpenSocial gadget.
Sample CURL call:
curl -H 'Content-Type:application/json+nxrequest' -X POST -d
'{"params":{"counterNames":"org.nuxeo.web.requests"}}' -u
Administrator:Administrator http://localhost:8080/nuxeo/site/automation/Counters.GET