Building Custom Dashboards
Before building your own custom dashboards please make sure you fulfill the requirements in the Customize Your App with Nuxeo Elements page.
The quickest way to start building a dashboard is to use the Polymer Generator to scaffold our custom elements.
Generate a
nuxeo-sampledashboard element:mkdir -p nuxeo-sample-dashboard && cd $_ yo polymer:seed nuxeo-sample-dashboardNote: It is a good practice to build dashboards as custom elements since you can then use them anywhere you see fit. But you can also build dashboards as full applications in which case the Yeoman polymer application generator should be used instead.
Once the
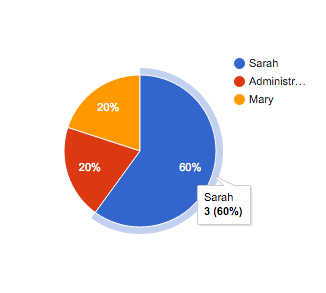
nuxeo-sampleelement is generated you can install further client side dependencies. In this case you need the Nuxeo Data Visualization Elements and a charting library to produce charts for your dashboard:bower install --save nuxeo/nuxeo-dataviz-elements bower install --save GoogleWebComponents/google-chartYeoman scaffolded a sample custom element so you now need to replace this sample content with your own. In this example build a simple chart with the total number of Serial Review workflows started by each user:
nuxeo-dataviz-sample.html<dom-module id="nuxeo-dataviz-sample"> <template> <!-- Retrieve our data and store it in 'initiators' --> <nuxeo-workflow-data workflow="SerialDocumentReview" event="afterWorkflowStarted" grouped-by="workflowInitiator" start-date="[[startDate]]" end-date="[[endDate]]" data="{{initiators}}"> </nuxeo-workflow-data> <!-- Display a Pie Chart with out data --> <google-chart type="pie" cols='[{"label": "User", "type": "string"},{"label": "Value", "type": "number"}]' rows="[[_rows(initiators)]]"> </google-chart> </template> </dom-module> <script> Polymer({ is: 'nuxeo-dataviz-sample', // Expose startDate and endDate as properties properties: { startDate: String, endDate: String }, // Transform our data for usage with Google Charts _rows: function(data) { return data.map(function(e) { return [e.key, e.value]; }); } }); </script>Each Polymer element usually includes a usage demo which you can edit to see and showcase your custom element in action:
demo/index.html<html> <head> ... <link rel="import" href="../../nuxeo-elements/nuxeo-connection.html"> <link rel="import" href="../nuxeo-dataviz-sample.html"> </head> <body unresolved> <!-- Define a connection to our Nuxeo server --> <nuxeo-connection url="http://localhost:8080/nuxeo" username="Administrator" password="Administrator"></nuxeo-connection> <!-- Include our element and specify a start and end date --> <nuxeo-dataviz-sample start-date="2015-09-01" end-date="2015-10-30"></nuxeo-dataviz-sample> </body> </html>To checkout your element we recommend using Polyserve, a simple web server for using bower components locally, which you can install with:
npm install -g polyserve
polyserve -p 3000
Once Polyserve is up and running we can finally see our custom element's demo at: http://localhost:3000/components/nuxeo-dataviz-sample/demo/