Managing sizing and performance of any ECM application is a tricky job, because each application is different and many factors must be taken into account.
The Nuxeo Platform is designed to optimize performance. As a consequence, continuous performance testing is part of the Nuxeo quality assurance process. Results are based on metrics that focus on user experience, such as application response time. The outcome of this continuous, measured improvement is that the Nuxeo Platform gives rapid response times even under heavy loads, with thousands of concurrent users accessing a repository that stores millions of documents.
Performance of the Nuxeo Platform
The first step is to identify which factors do impact performance and which factors do not impact performance.
Impacting Factors
Security Policies
The typical behavior of an ECM system is that you can only view a Document if you are allowed to. The same principle applies to creating or modifying documents. However, the "Access Check" is the most factor that impacts most significantly because the system may need to check for read access on a very large number of documents.
The default security policy in Nuxeo uses ACLs (Access Control Lists). Depending on the target use cases, you may have very few ACLs (when ACLs are defined only on top containers) or a lot of ACLs (when they are defined on almost every documents). To be able to deal with both cases, Nuxeo provides several optimizations in the way ACLs are processed: for example, ACL inheritance may be pre-computed. But depending on the target use-case, the best solution is not always the same one.
In the Nuxeo Platform we allow to define custom security policies that can be based on business rules. We also provide ways to convert these business rules into queries so that checks can be done quickly on huge documents repositories.
As a security policy is clearly an impacting factor, the Nuxeo Platform provides a lot of different optimizations. You can then choose the one that fits your needs.
Presentation Layer
The presentation layer is very often the bottleneck of an ECM web application.
It is easy to make mistakes in the display logic (adding costly tests, fetching too much data ...) that can slow down the application. This is particularly true when using JSF, but even when you use another presentation technology, it is possible to impact performance by wrongly modifying some templates.
The good news is that Nuxeo's default templates are well tested. However, when modifying Nuxeo's template or add a new custom one, web developers must be aware of performance issues:
- You don't want to have a round trip to database inside a display loop (that's what prefetch is done for)
- You don't want a costly business test to be done 20 times per page (that's what Seam context is made for)
- You don't want a single page listing 100 000 documents (because there is no user able to use it and that the browser won't be happy)
- ...
This may seem obvious, but in most cases you can solve performance issues just by profiling and slightly modifying a few display templates.
Document Types
A very common task in an ECM project is to define your own Document Types. In most cases it will have little or no impact on performance.
However, if you define documents with a lot of meta-data (some people have several hundred meta-data elements) or if you define very complex schema (like nesting complex types on 4 levels), this can have impact on:
- The database : because queries will be more complex
- The display layer : because correctly configuring prefetch will be very important
For configuring the prefetch settings, please see the configuration extension point of the TypeService.
The default configuration is adequate for the default Nuxeo ContentViews, but you may need to adjust that for your use cases.
Number of Documents
As expected, the number of documents in the repository has an impact on performance:
- Impact on database size, and as a consequence on the database performance
- Impact on ACLs management
- Possible impacts on UI listings
This is a natural impact and you cannot exclude this factor when doing capacity planning.
The good news is that Nuxeo's document repository has been tested successfully with several million documents with a single server.
Concurrent Requests
The raw performance of the platform is not tied to a number of users but to a number of concurrent requests: 10 hyperactive users may load the platform more than 100 inactive users.
In terms of modeling the users activity, think in terms of Transaction/s or Request/s: concurrent users is usually too vague.
Factors That Have Little or no Impact
Size of the Files
When using Nuxeo's repository, the actual size of the binary files you store does not directly impact the performance of the repository. Since the binary files are stored in a Binary Store on the file system and not in the Database, impact will be limited to Disk I/O and upload/download time.
Regarding binary file size, the only impacting factor is the size of the full-text content because it will impact the size of the full-text index. But in most cases, big files (images, video, archives ...) don't have a big full-text content.
Average Number of Documents per Folder
A common question is about the number of documents that can be stored in a Folder node. When you use Nuxeo's VCS repository, this has no impact on the performance: you can have folders with several thousands of child documents.
When designing your main filing plan, the key question should be more about security management, because your hierarchy will have an impact on how ACLs are inherited.
Some Generic Tips for Tuning the Nuxeo Platform
Independent from use cases, some technical factors have an impact on performance:
Application Server
The Nuxeo Platform is available on Tomcat and JBoss servers. Tomcat tends to have better raw performance than JBoss.
Tomcat HTTP and AJP connector configuration impact the behavior of the server on load, limiting the maxThread value to prevent the server from being overloaded and to keep constant throughput.
Under load the JBoss JTA object store can generate lots of write operations even for read-only access. A simple workaround can be to use a ramdisk for the server/default/data/tx-object-store folder.
Note also that the default maximum pool size for the AJP connector on JBoss is only 40, which can quickly become a bottleneck if there is no static cache on the frontal HTTP server.
JVM Tuning
Always use the latest 1.8 JDKs, they contain performance optimizations.
Log Level
Log level must be set to INFO or WARN to reduce CPU and disk writes.
Database
Database choice has a large impact on performance.
PostgreSQL has more Nuxeo optimizations than other databases. It is the preferred database platform.
Tuning is not optional, as Nuxeo does not provide default database configurations for production.
Network
The network between the application and the database has an impact on performance.
Especially on a page that manipulates many documents and that generates lots of micro JDBC round trips.
Our advice is to use a Gigabit Ethernet connection and check that any router/firewall or IDS don't penalize the traffic.
Here are some example of the command ping -s PACKETSIZE in the same network (MTU 1500) that can give you an idea of the latency added to each JDBC round trip:
| Ping Packet Size | Fast Ethernet (ms) | Gigabit Ethernet (ms) | Ratio |
|---|---|---|---|
| default | 0.310 | 0.167 | 1.8562874 |
| 4096 | 1.216 | 0.271 | 4.4870849 |
| 8192 | 1.895 | 0.313 | 6.0543131 |
While the database will process a simple request in less than 0.05ms most of the JDBC time will be spend on the network from 0.3ms on Gigabit Ethernet to 1.9ms on Fast Ethernet (6 times more).
Note that you can check your network configuration using the ethtool command line.
If you have a firewall or your database don't reply to ICMP ping, you can test the network latency using a tool like jdbctester.
Also knowing your JDBC driver configuration may help, for instance Oracle by default do a round trip every 10 rows, this can be changed using the following JAVA_OPTS:
-Doracle.jdbc.defaultRowPrefetch=50
How we Manage the Nuxeo Platform Performance
Now, that we have seen that managing performance involves many factors, let's see how we manage this at Nuxeo for the Platform and its modules.
A Toolbox for Benchmarking the Nuxeo Platform
We provide several tools to load test and benchmark the Platform: see the Tool chapter later in this document.
Continuous Performance Testing via CI
Benchmarking once is great, but the real challenge is to be sure to detect when performances are impacted by a modification (in the UI, in the Document Types, ...).
To do so, we use small benchmark tests that are automatically run every night by our CI chain. The test is configured to fail if the performance results are below the performance results of the previous build.
This fast bench enables to check core and UI regressions on a simple case.
- Hudson benching job
- Daily bench report
- Daily bench monitoring report
- Benching script sources
This allows us, for example, to quickly detect when a template has been wrongly modified and lets us quickly correct it before the faulty changeset becomes hidden by hundreds of other modifications.
Periodic Benchmark Campaigns
Every 2 or 3 months, we run major benchmarking campaigns to tests the platform on the limits.
This is a great opportunity to do careful profiling and eventually introduce new database and Java optimizations.
Sizing your Nuxeo Platform-Based ECM Application
In order to correctly size your Nuxeo Platform-based ECM application, you should:
Define your Requirements
You have to define your needs and hypotheses for any factor that can impact the platform performance:
- Target number of documents in the repository
- Target security policy
- Target filing plan and ACLs inheritance logic
- Target request/s
Set up Performance Testing From the Beginning
Performance benchmarking is not something you should postpone to a pre-production phase. It's far more efficient (and cheaper) to setup performance tests from the beginning.
Start with simple benchmark tests (based on the ones provided by Nuxeo) on a raw prototype and improve them incrementally as you improve your customization.
Using this approach will help you:
- Detect a performance issue as soon as possible
- Correct small problems when they are still small
- Avoid having a lot of mistakes to correct just before going to production
You can leverage all the standard tests we provide and also the Hudson integration if you want to use Hudson as CI chain provider.
Use Interpolation When Needed
Nuxeo provides standard benchmarks for both small and big documents repositories.
When needed, you can use these results to interpolate results from your tests.
Performance Toolbox Provided by the Nuxeo Platform
Benchmarking Tools
We use FunkLoad for performance testing. This tools enables us to produce quickly new scenarios. Here are the main advantages:
- An HTTP proxy recorder generates the initial bench script.
- FunkLoad comes equipped and ready with "batteries included":
- Helpers to make assertions
- Library to generate random content
- Library to share user credentials between threads
- Basic monitoring
- Scripts are done in Python which enables complex scenario implementation.
- Benches are easily automated using simple Makefile.
- FunkLoad produces a detailed report and differential report to compare two bench results.
Nuxeo has a Python library to write tests with a "fluent interface pattern" like:
(LoginPage(self).view()
.login('Administrator', 'Administrator')
.getRootWorkspaces()
.createWorkspace('My workspace', 'Test ws')
.rights().grant('ReadWrite',  'members')
.view()
 .logout())
This makes it easy to create new scenarios.
Also to stress heavily the REST API we use Gatling.
We also use Nuxeo Platform addon tools like nuxeo-platform-importer to populate the document base.
Metrics to Monitor During a Bench
- CPU: The iowait or percent of time that CPU is idle during which the system has outstanding disk I/O request can be useful to identify an I/O bottleneck. On multi CPUs, if only one of the CPU is used at 100%, it may be the cause of an overloaded garbage collector.
- JVM Garbage Collector throughput: this is the percentage of total time of the JVM not spent in garbage collection.
- Disk utilization: to check for device saturation
- Size of connection pools (HTTP, database)
- SQL queries that took up most time.
Monitoring Tools
A Graphite server can monitor Nuxeo, the back ends (PostgreSQL/MongoDB, Redis, Elasticsearch) and the system.
You can also use other tools to get more information:
- Oracle flight recording
- Nuxeo Slow NXQL Queries
- PostgreSQL monitoring
- sysstat sar and atop to monitoring the system activity (CPU, disk, network, memory ...).
Nuxeo Metrics Monitoring Tools with Mbeans
In nuxeo-runtime-management-metric, Nuxeo provides the infrastructure that can be used to monitor use of services or class through MBeans. The MBean displays access counts on methods and the time spent on it. It can also serialize its results in XML.
As an example, we will first see how to configure and monitor access to the Nuxeo repository backend class.
Monitor Nuxeo Core Backend Access
The idea is to plug our monitor class as a proxy of the real Repository class. When a method gets through the proxy, metrics are automatically added and named with interface and method names. All metrics have an operation "Sample" that provides the metrics you are looking for.
Modify the file
config/default-repository-config.xml(be careful to modify the right file if you are using templates configuration system) and add this line:<backendClass>org.nuxeo.ecm.core.storage.sql.management.MonitoredJDBCBackend</backendClass>This class is a proxy to the real
backendclass. Nuxeo VCS core storage will behave exactly like before. The proxy just counts and records time spent on each method of the interface, and make it available to the MBean.When using VCS remote on a deported client, the class to used is
MonitoredNetBackend.- To view the result, run jconsole or Visualvm.
- Connect to your running Nuxeo repository Java process.
- Go to the MBean tab
- In the MBeans
org.nuxeoyou will find all the metrics. MetricEnable contains operations to enable/disable logging and serialisation. Serialisation is used to have an XML output. Preferences can be set with MetricSerializer operations.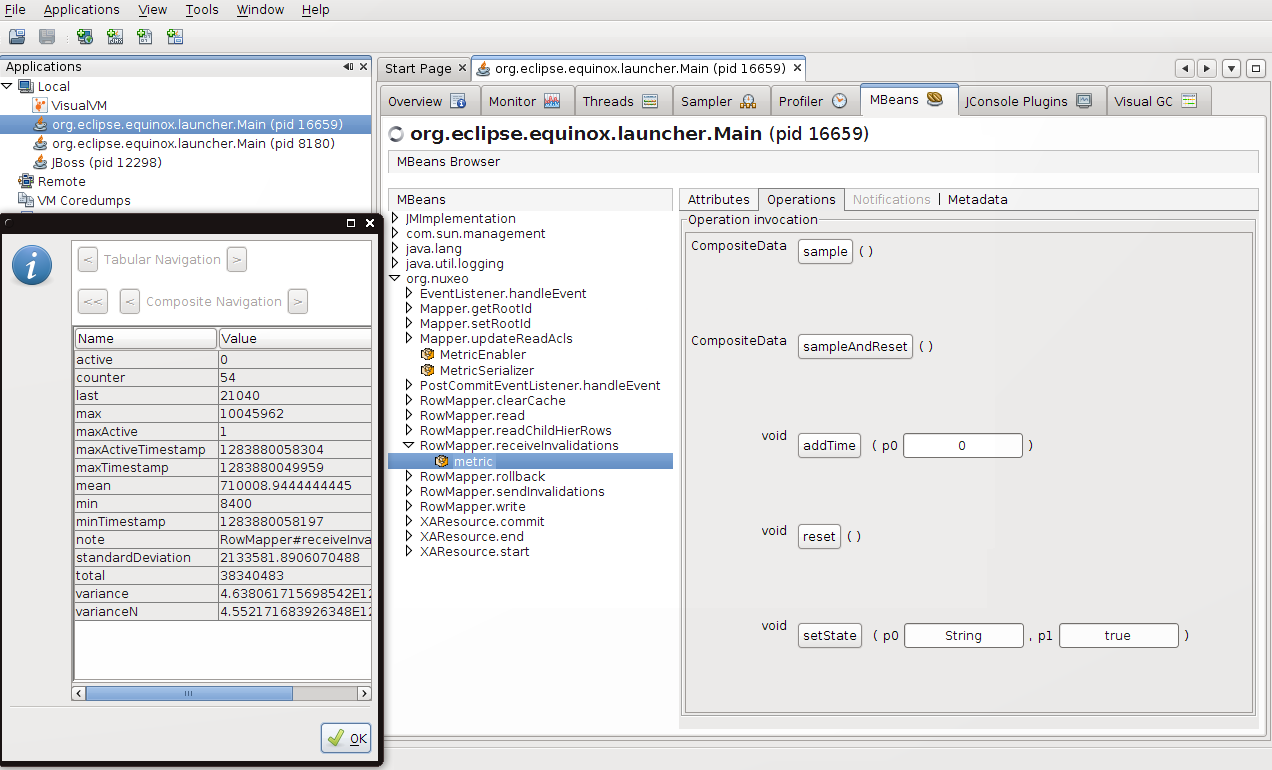
Create Your Own Monitored Proxy
The previous example had its proxy class available in the Nuxeo Platform and the backend class could easily be replaced by modifying an extension point. However, creating a new proxy class is still easy. Let's try adding a monitor proxy to all the listener to monitor Listener access:
Listener objects are created in EventListenerDescriptor: initListener.
The idea is to create the proxy with MetricInvocationHandler.newProxy and provide the instance to proxy and the Interface class to monitor.
The proxy will replace the original instance:
public void initListener() throws Exception {
        if (clazz != null) {
            if (EventListener.class.isAssignableFrom(clazz)) {
                inLineListener = (EventListener) clazz.newInstance();
                inLineListener = MetricInvocationHandler.newProxy(
                        inLineListener, EventListener.class);
                isPostCommit = false;
            } else if (PostCommitEventListener.class.isAssignableFrom(clazz)) {
                postCommitEventListener = (PostCommitEventListener) clazz.newInstance();
                postCommitEventListener = MetricInvocationHandler.newProxy(
                        postCommitEventListener, PostCommitEventListener.class);
                isPostCommit = true;
            }
Restarting the repository and accessing to the proxy will make the class monitored in the monitoring tool.
Some Example Benchmark Results
10 Million Documents Injection
Goals
Demonstrate adequate response times for various document retrieval and insertion operations on a large storage of 10 million documents.
This benchmark was initially run in 2010 against a Nuxeo 5.3.1.
Steps
- Tune the database following tips in the Nuxeo PostgreSQL FAQ.
- Tune Nuxeo: for mass import, we disable the full-text indexing (as described in the "Mass import specific tuning" section of PostgreSQL configuration page) and disable the ACL optimization (NXP-4524).
- Import content: mass import is done using a multi-threaded importer to create File document with an attached text file randomly generated using a French dictionary. Only a percentage of the text file will be indexed for the full text, this ratio simulate the proportion of text in a binary format. Sources of the nuxeo-platform-importer
- Rebuild full text as described in the "Mass import specific tuning" FAQ.
- Generate random ACLs on documents. This can be done with a simple scripts that generate SQL inserts into the ACL table.
Enable the read ACLs optimization, performing the SQL command:
SELECT nx_rebuild_read_acls();Enable the ACL optimization (NXP-4524).
- Bench using the same scripts as in continuous integration for writer and reader. In addition we have a navigation bench that randomly browses folders and documents.
Results Overview
The base was successfully loaded with:
- 10 million of documents
- 1TB of data
Below are some average times:
- Accessing a random document using the Nuxeo web interface under load of 250 concurrent users accessing the system with 10 seconds pause between requests: 0.6s.
- Accessing a document that has already been accessed, under load: 0.2s.
- Accessing a random document or download attached file using a simple WebEngine application: 0.1s. It can handle up to 100 req/s which can be projected to at least 1000 concurrent users.
- Creating a new document using the Nuxeo web interface under load: 0.8s.
This bench showed no sign of being impaired by the data volume once the data was loaded from disk.
http://public.dev.nuxeo.com/~ben/bench-10m/
From 10 Million Documents to 1 Billion
Since 2010, the Nuxeo Platform has evolved and so did the hardware.
Goals
Show that the Nuxeo Platform can handle very large volume by leveraging sharding.
About the Bench
The bench started as the 2010 bench with 10 million documents, we simply use a recent Nuxeo Platform as well as more recent hardware.
We were easily able to inject 100 million documents inside a single document repository at a constant throughput. Then, we used the multi-repository feature as well as Elasticsearch integration to shard 1 billion document across ten repositories with a single index.
More details about how the bench was done can be found on the blog post "One Billion Documents, Testing the Limits of Nuxeo".
Results Overview
Injection:
- Document import runs at 6,000 documents/second
- Full-text indexing inside Elasticsearch runs at 3,500 documents/second
Retrieve via API:
- More than 3,000 requests/second
Unfortunately, as explained in the blog post, we did not have the opportunity to continue the bench until we get to the bottom of it: we knew we could do better.
Scaling out on Multiple Nodes
Goals
Continue the previously started bench and go further to validate the capability to scale out the number of requests /seconds.
About the Bench
The bench started as the previous one with some bulk import to inject some volume into the repository (here we used two of them).
However, the focus of the bench was to be able to handle a large number of API calls per seconds, including for complex search.
To achieve that we used several capabilities of the platform:
- Separate repositories between import and reads
- Configure API to search and fetch from Elasticsearch
- Use Elasticsearch to scale out the requests
More details about how the bench was done can be found on the blog post "Can the Nuxeo Platform scale to the next level…again? Yes!"
Results Overview
After some tuning and having configured the search & fetch from Elasticsearch, on one node,we already had very good results:
- More than 2,200 requests/second
- Average response time < 25ms even for rather complex calls
Then adding two more nodes (total of three nodes), we were able to reach 6,000 requests/second.
Customizing the Bench
The bench procedure can be customized to validate customer installation:
- The mass importer tool can be used as a template to inject a customized document type instead of File documents.
- Scripts can be modified to have realistic scenarios.
- Scripts can be combined to create realistic loads.