Metrics
The platform uses Coda Hale Yammer Metrics.
These metrics are exposed via JMX but can also be reported with CSV files or send to a Graphite server.
List of Metrics
Here is a short list of Nuxeo metrics:
nuxeo.repositories.default.documentscreateCounter of document createddeleteCounter of document deletedupdateCounter of document updated
nuxeo.repositories.jdbc/nuxeo.connectionscountVCS connection countidleVCS idle connection count
nuxeo.transactions.concurrentscountCounter for concurrent transactionmaxMaximum value of the previous counter
nuxeo.transactions.durationTimer for transactionsnuxeo.transactions.rollbacksCounter for transactions in failurenuxeo.works.<WORKER_POOL>:completedCounter for completed jobsrunningCounter of running jobsscheduled.countCounter of job waiting to be processedscheduled.maxMaximum scheduled jobstotalTimer for the job duration
nuxeo.elasticsearch.servicebulkIndexTimer for bulk index operationsindexTimer for index operationsdeleteTimer for deletion operationssearchTimer on search operationsfetchMeasure the time to retrieve documents
nuxeo.ActionServiceationsoractions(typo fixed for versions 7.10-HF13 and 8.4) Timer for actions retrieval given a category (including filters evaluation)actionTimer for action retrieval given the action id (including filters evaluation)filtersTimer for filters evaluation for a given actionfilterTimer for filter evaluation for a given filter id
See this JMX monitoring page to get a list of all available metrics.
Note that metrics are prefixed depending on how they are exposed, for instance a counter like nuxeo.repositories.default.documents.create will be accessible:
- in graphite with the name
servers.myhostname.nuxeo.nuxeo.repositories.default.documents.create.count - in JMX with a mbean named:
metrics:name=nuxeo.repositories.default.documents.create
To have a complete monitoring you should also monitor the system, the database and the Elasticsearch cluster, a tool like Diamond can do this easily.
The default prefix (servers.${HOSTNAME}.nuxeo) used by the Graphite reporter is compatible with Diamond but it can be changed by the setting metrics.graphite.prefix innuxeo.conf.
Publishing Metrics
Enabling JMX Reporting
To enable JMX reporting add the following to the nuxeo.conf file:
JAVA_OPTS=$JAVA_OPTS -Dcom.sun.management.jmxremote=true
You then have to manage security for this access, since there is no authentication by default.
Enabling CSV Reporting
metrics.csv.enabled=true
# The amount of time in second between metrics publication
metrics.csv.period=30
# This will create a sub directory metrics-TIMESTAMP
metrics.csv.dir=${nuxeo.log.dir}
Enabling Graphite Reporting
metrics.graphite.enabled=true
metrics.graphite.host=localhost
metrics.graphite.port=2003
# The amount of time in second between metrics publication
metrics.graphite.period=30
Reporting Tomcat JMX Info
metrics.tomcat.enabled=true
Reporting Log4j Info
metrics.log4j.enabled=true
This is very handy to report total number of ERROR or WARN in the server.log.
Reporting to Datadog
You can report Nuxeo metrics to Datadog using the package: https://github.com/nuxeo/marketplace-datadog
Metrics rendering
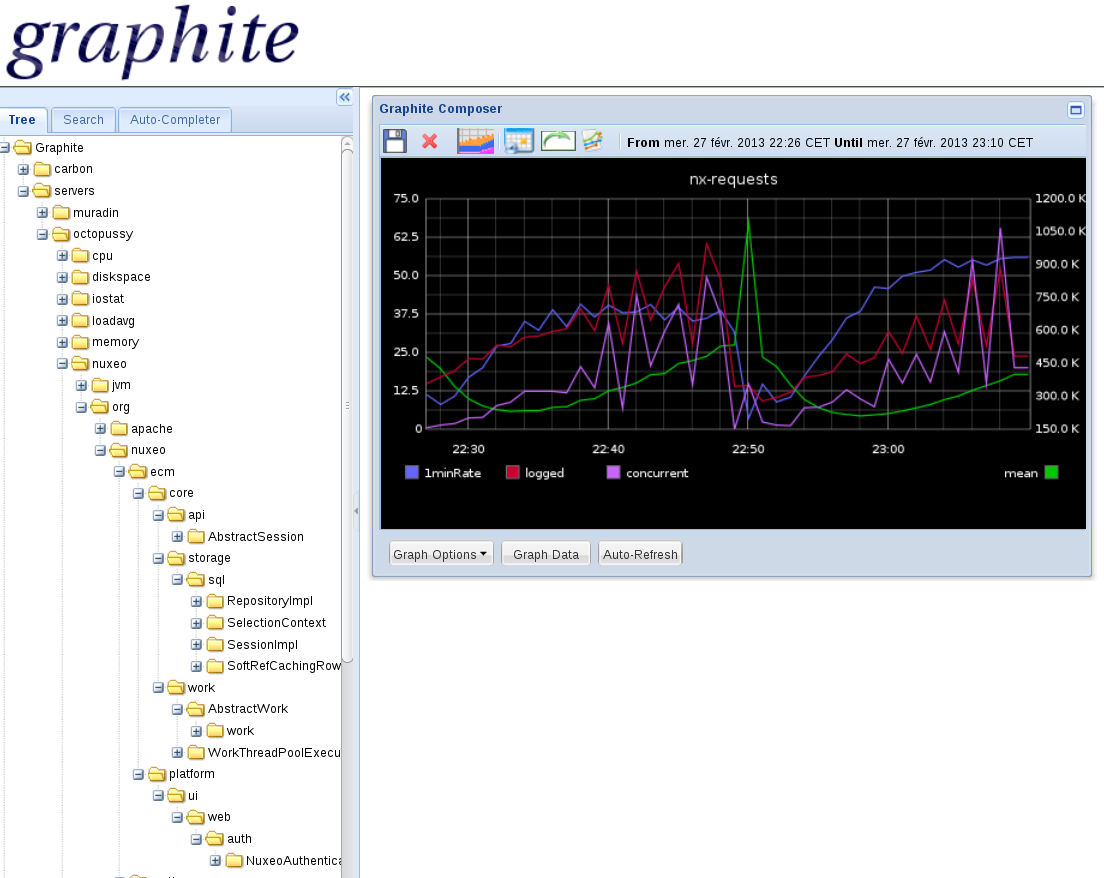
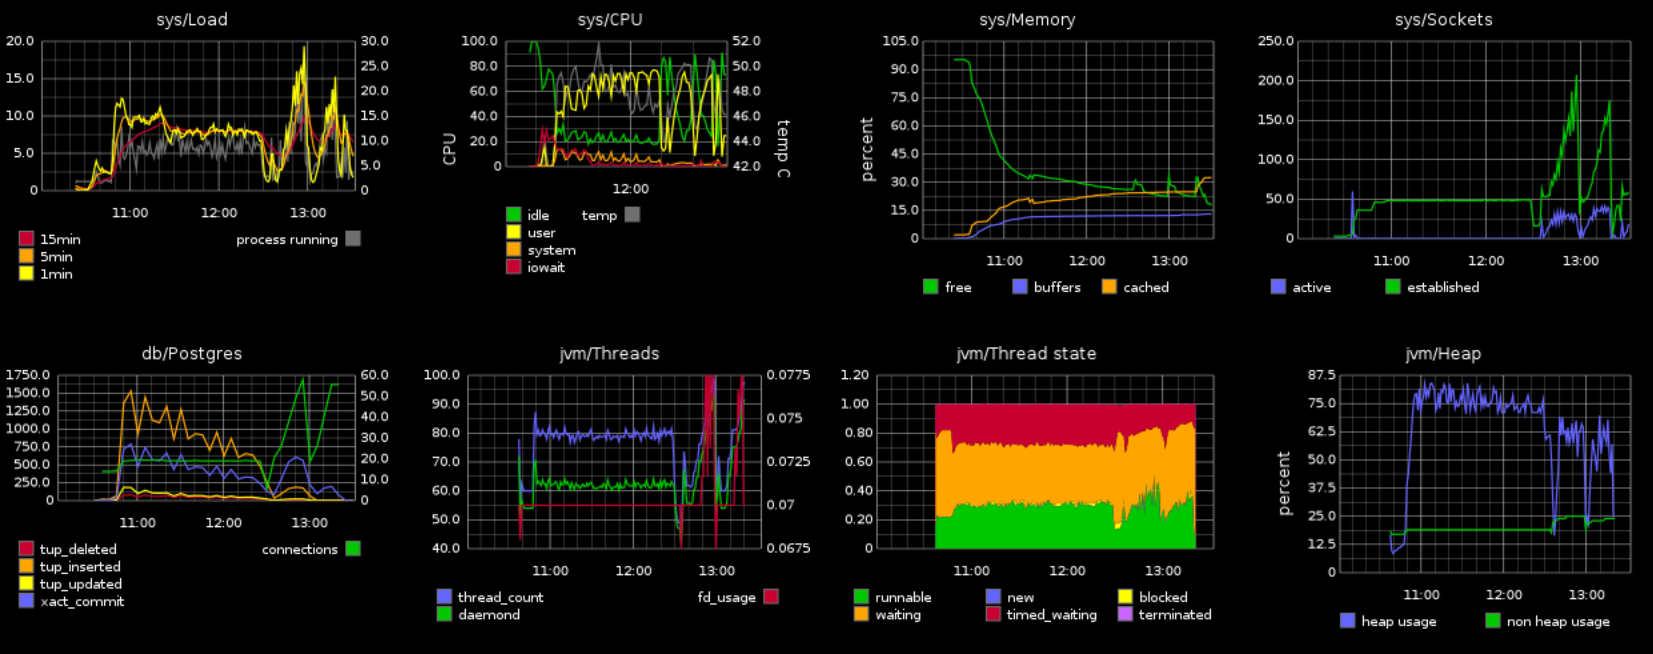
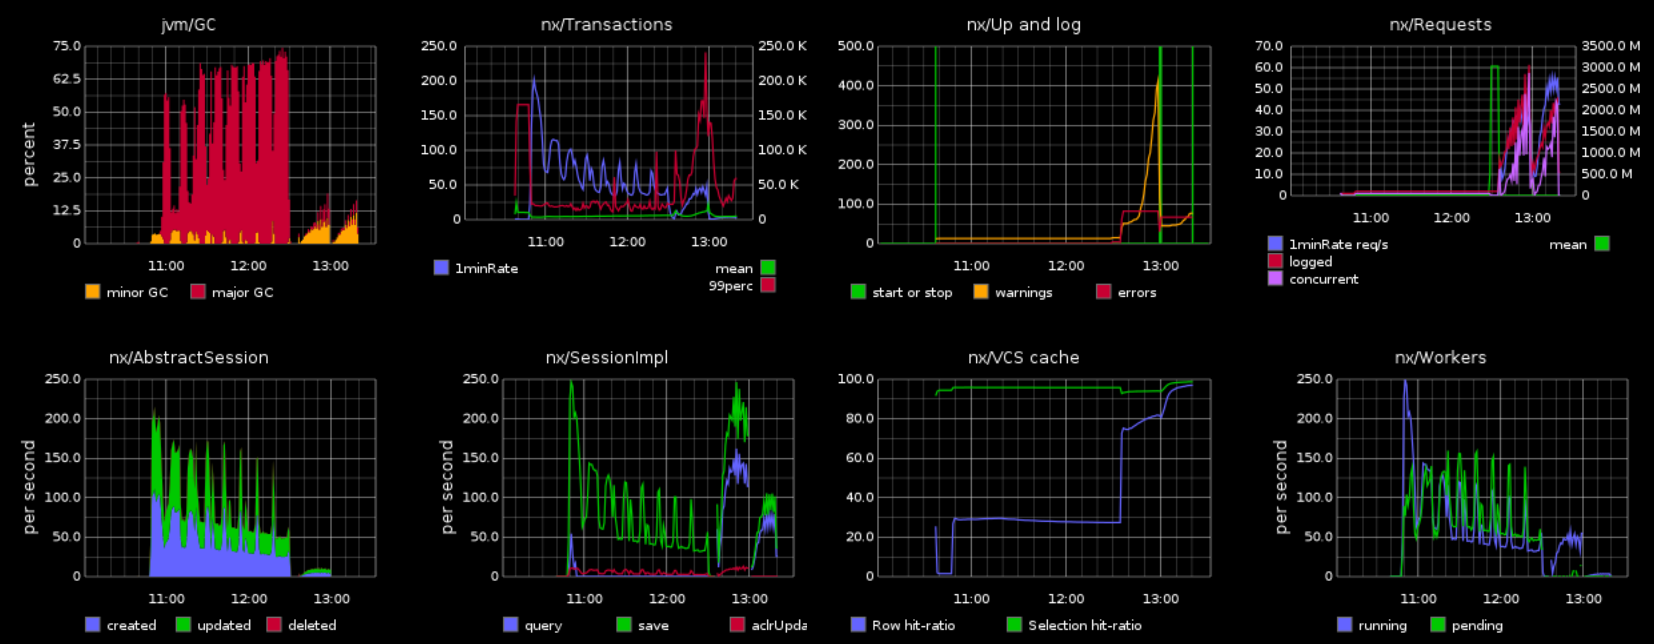
Graphite Dashboard
You can find an example of Graphite dashboard on GitHub: https://github.com/nuxeo/nuxeo-runtime/blob/master/nuxeo-runtime-metrics/graphite/dashboard.json.
You will have to edit the dashboard to replace the hostname (here it is octopussy).
Here is an extract of what this dashboard looks like when monitoring a daily bench.
Grafana
Metrics published to Graphite can also be rendered with Grafana.
Monitoring
The Nuxeo Platform also comes with a set of default probes and administrative statuses for monitoring, that are provided by the component Nuxeo Core Management. Both can be seen and managed from JMX and from Admin Center.
Administrative Status
An administrative Status is a way to define cluster-wide or instance-wide named variables that can be used to manage the status of a running platform:
- turn on/off a node of the cluster,
- display a message to all users of the platform,
- ...
By default only three statuses are defined:
nuxeoInstance: indicates if a Nuxeo instance (cluster node) is active of not,adminMessage: message to be displayed to all users,smtpService: defines if SMTP gateway can be used.
Administrative Status can be configured and declared via the serviceDefinition extension point.
Probes
Probes can be used to run a test on the target deployed platform. Probes can be used to check that all part of the architecture are actually running for real:
- check LDAP access,
- check instance availability,
- check VCS access,
- ...
Probes can be defined via the probes extension point.
By default four probes are defined:
adminStatus: checks local instance enable flag (checksnuxeoInstanceadminsitrative status),activeRepositorySession: returns the number of active sessions per repository,ldapDirectory: check LDAP connectivity,remoteSQLStorageSession: number of remove VCS client connected (only used in VCS client/server mode that is not enabled by default).
Probes can also be run as part of the healthCheck when invoking the Status servlet. By default the following probes are enabled for the check:
s3BinaryManagerStatusruntimeStatuselasticSearchStatusldapDirectoriesrepositoryStatus
Probes can be enabled/disabled for the healthCheck using the healthCheck extension point.
Monitoring Using JMX Access
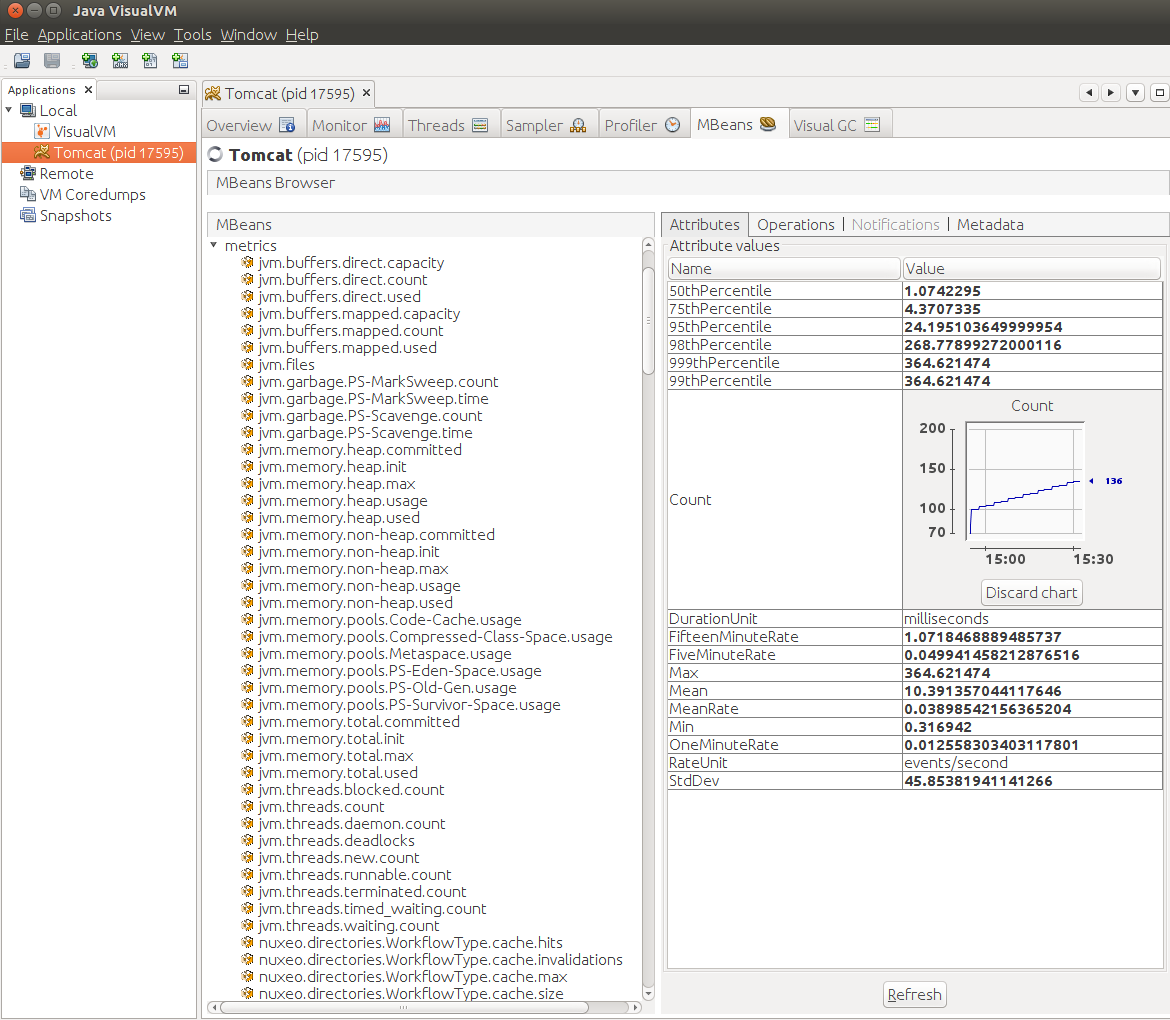
You can use JVisualVM or similar tool to access Nuxeo JMX interface. See the section Enabling JMX Access.
Monitoring Using the Admin Center
Inside the Admin Center there are two sections that are related to monitoring: Activity and Monitoring.
Activity
The Activity section provides access to:
A Users sessions tab that displays counters for the web UI access:
- Total number of active HTTP sessions: The number of user active user session on the UI.
- Total number of HTTP requests: The number of requests for page and dynamic resources served by JSF/faces.
- List active sessions within a duration.
- A view on audit event logs
- The background jobs
- Repository analytics
The Activity section provides access to:
- A view that displays HTTP counters (requests and sessions)
- A view on audit logs
- Activity charts based on web and repository counters
Monitoring
The Monitoring sections provides access to:
- A view on Administrative Status (view/edit)
- A view on probes (view/run)
- A view that allows to enable Event Listener statistic gathering
REST Access
Counters
Counter are exposed via Automation API Counters.GET
Sample CURL call:
curl -H 'Content-Type:application/json+nxrequest' -X POST -d
'{"params":{"counterNames":"org.nuxeo.web.requests"}}' -u
Administrator:Administrator http://localhost:8080/nuxeo/site/automation/Counters.GET