The Nuxeo code is instrumented using Dropwizard Metrics.
This library enables to report different type of metrics:
- Counters: a value that can increase (or decrease), for instance the number of created documents.
- Gauges: this is an instantaneous measurement of a value. For example, the size of a cache.
- Timers: it measures both the rate that a particular piece of code is called and the distribution of its duration. For example, it provides the min, max, average and percentiles for a request duration but also the number of requests per second, the total number of requests and, the total elapsed time.
Nuxeo metrics can be reported to various Monitoring systems.
To have a complete monitoring you should also monitor the operating system where Nuxeo is running as well as other services: databases, Elasticsearch, Redis or Kafka.
Supported Monitoring Systems
Nuxeo uses a MetricReporter interface to publish its metrics and provides multiple implementations,
the system can be extended to support other monitoring systems.
By default, since Nuxeo 11, we have the following metric reporters:
- JMX
- Graphite
- Datadog
- Prometheus
- GCP Metrics (previously known as Stackdriver)
It is possible to activate multiple reporters at the same time.
Depending on the chosen metric reporter, Nuxeo will push metrics or the metric system will poll Nuxeo for metrics. For instance, metrics are pushed to Graphite and Datadog while Prometheus is polling Nuxeo for metrics.
Monitoring systems are either hierarchical or dimensional:
- Hierarchical Monitoring system uses a flat metric name, like a file system tree. Example of such system are: JMX, Graphite, StatsD, Ganglia, ...
- Dimensional Monitoring system uses metric names enriched with tag key/value pairs. Example of such system are: Prometheus, Datadog, influxDB, ...
Since Nuxeo 11 the instrumentation of the code uses metric names with tags (dimensional metric). Hierarchical monitoring reporters flatten the tags into the metric name.
For instance, a gauge that measures the pending video conversions on a Nuxeo cluster is named nuxeo.works.global.queue.scheduled and has the following tag: queue=videoConversion
that express the work queue dimension, the metric name is translated into:
| Monitoring system | type | metric |
|---|---|---|
| JMX | hierarchical | #mbean = metrics:name=nuxeo.works.global.queue.scheduled,queue=videoConversion,type=gauges |
| Graphite | hierarchical | ${PREFIX}+nuxeo.works.global.queue.videoConversion.scheduled |
| Datadog | dimensional | nuxeo.works.global.queue.scheduled queue:videoConversion host:nuxeo |
| Prometheus | dimensional | dropwizard5_nuxeo_works_global_queue_scheduled_gauge{instance="nuxeo:8888",job="nuxeo",queue="videoConversion"} |
| GCP Metrics (Stackdriver) | dimensional | custom.googleapis.com/nuxeo/dropwizard5_nuxeo.works.global.queue.scheduled queue:videoConversion |
Note that the tag value (videoConversion in the above example) can be rewritten as a valid identifier, for instance a value of audit/writer will be translated into audit-writer
JMX Reporter
To activate the JMX reporting you need a nuxeo.conf with the following options:
metrics.enabled=true
metrics.jmx.enabled=true
Metrics are exposed in a metrics MBean domain.
Note that to access the JMX MBean you need to activate JMX using JAVA_OPTS:
JAVA_OPTS=$JAVA_OPTS -Dcom.sun.management.jmxremote=true
Visit this page to see how to dump all metrics.
$ echo "get -b metrics:name=nuxeo.works.queue.timer,queue=default,type=timers *" | java -jar /tmp/jmxterm-1.0.1-uber.jar -l localhost:1089 -n
Welcome to JMX terminal. Type "help" for available commands.
#mbean = metrics:name=nuxeo.works.queue.timer,queue=default,type=timers:
50thPercentile = 0.0;
DurationUnit = microseconds;
Max = 76000.0;
75thPercentile = 0.0;
95thPercentile = 0.0;
98thPercentile = 0.0;
99thPercentile = 0.0;
999thPercentile = 24000.0;
Mean = 67.96712231400461;
StdDev = 1250.994358152994;
Min = 0.0;
Count = 60;
RateUnit = events/second;
Sum = 509000.0;
FifteenMinuteRate = 0.021929133134494853;
FiveMinuteRate = 0.011975928378019026;
MeanRate = 0.047353163048175675;
OneMinuteRate = 5.608847244891202E-4;
Graphite Reporter
Metrics are pushed to Graphite every pollInterval.
Default reporting is done using TCP but if possible UDP should be chosen.
If unspecified the default prefix is server.<HOSTNAME>.nuxeo.
The nuxeo.conf options are:
metrics.enabled=true
metrics.graphite.enabled=true
metrics.graphite.host=GRAPHITE_HOST
metrics.graphite.port=2003
metrics.graphite.udp=false
metrics.graphite.pollInterval=60
metrics.graphite.prefix=
Datadog Reporter
Configuration:
metrics.enabled=true
metrics.datadog.enabled=true
metrics.datadog.pollInterval=60
metrics.datadog.apiKey=YOUR_API_KEY
metrics.datadog.tags=nuxeo
metrics.datadog.hostname=
metrics.datadog.udp=false
metrics.datadog.host=localhost
metrics.datadog.port=8125
The metrics.datadog.apiKey is required when publishing directly to Datadog, in this case host and port are not required.
When UDP is chosen, the metrics.datadog.host and metrics.datadog.port must refer to a Datadog agent in charge of forwarding metrics into the cloud.
Additional tags can be added to all metrics using metrics.datadog.tags.
Metrics are polled from Nuxeo and pushed to Datadog using the defined pollInterval.
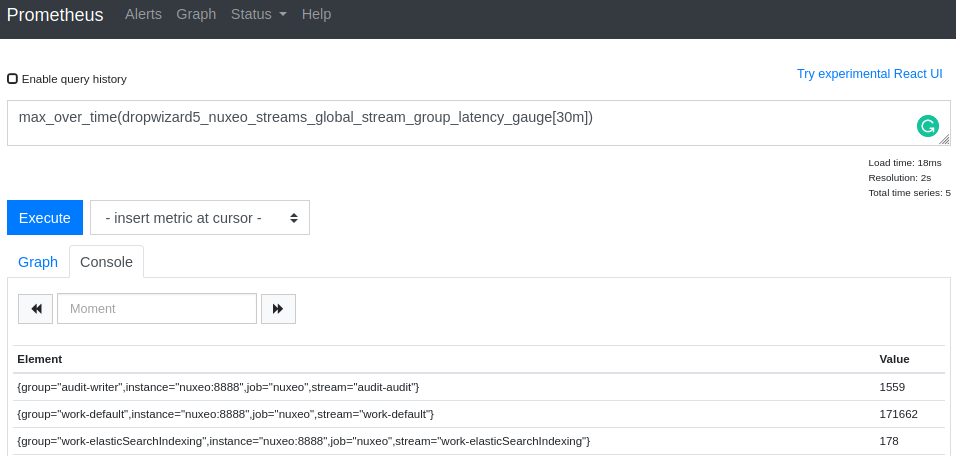
Prometheus Reporter
Configuration:
metrics.enabled=true
metrics.prometheus.enabled=true
metrics.prometheus.port=9090
Nuxeo is exposing a Prometheus endpoint on metrics.prometheus.port.
You have to manage security for this access and make sure it is accessible from Prometheus in order to scrape the metrics.
Note that the Dropwizzard Metrics are exposed using Opencensus, they are automatically prefixed by dropwizard5_
and suffixed depending on metric types (_gauge, _count and _timer).
GCP Metrics (Stackdriver)
You need to provide a valid GCP project identifier.
Configuration:
metrics.enabled=true
metrics.stackdriver.enabled=true
metrics.stackdriver.gcpProjectId=MY-GCP-PROJECT-ID
The metrics will be prefixed by custom.googleapis.com/nuxeo/dropwizard5_
Metrics Filtering
A counter or gauge instrumentation create a single metric, on the other hand a timer generates 16 metrics:
min: minimum measured timemax: maximum measured timemean: average measured timestddev: standard deviationp50: median or percentile 50%p75,p95,p98,p99,p999: percentilesm1_rate: moving average on the last minute of the throughputm5_rate,m15_rate: moving average on 5 and 15 minutesmean_rate: average throughputcount: number of timer callsum: total cumulative time
The number of metrics depends on the deployed repositories, directories, caches, work queues, computations, streams ... which can be a huge number. Fortunately it is possible to filter metrics.
Nuxeo comes with a default filter that:
- Reduces timer metrics by removing some percentiles and rates
- Accept only a few caches and directories metrics
- Deny other caches and directories
- Deny log4j metrics for the level below WARN
This filter can be found in common-base template in the metrics-config.xml file:
  <extension target="org.nuxeo.runtime.metrics.MetricsService" point="configuration">
    <configuration enabled="${metrics.enabled}">
      ...
      <filter>
        <allow>
          <prefix>nuxeo.cache.default-cache.</prefix>
          <prefix>nuxeo.cache.user-entry-cache.</prefix>
          <prefix>nuxeo.cache.group-entry-cache.</prefix>
          <prefix>nuxeo.directories.directory.userDirectory</prefix>
          <prefix>nuxeo.directories.directory.groupDirectory</prefix>
        </allow>
        <deny>
          <prefix>nuxeo.cache</prefix>
          <prefix>nuxeo.directories</prefix>
          <prefix>nuxeo.ActionService</prefix>
          <prefix>org.apache.logging.log4j.core.Appender.debug.count</prefix>
          <prefix>org.apache.logging.log4j.core.Appender.info</prefix>
          <prefix>org.apache.logging.log4j.core.Appender.debug</prefix>
          <prefix>org.apache.logging.log4j.core.Appender.trace</prefix>
          <prefix>org.nuxeo.ecm.core.management.standby.StandbyComponent</prefix>
          <!-- Timer expansion to remove -->
          <expansion>stddev</expansion>
          <expansion>p75</expansion>
          <expansion>p98</expansion>
          <expansion>p999</expansion>
          <expansion>m5_rate</expansion>
          <expansion>m15_rate</expansion>
          <expansion>mean_rate</expansion>
        </deny>
      </filter>
    </configuration>
  </extension>
Note that the prefix value used in the allow/deny rules is the beginning of the flatten metric name.
Metrics Description
This section describes the main metrics available by categories.
You will find the metric name and its associates dimensions.
Nuxeo Cache
All the following metrics have a cache dimension with the name of the cache.
Common caches are: default-cache or low level caches used by directories like: user-entry-cache or group-entry-cache.
nuxeo.cache.hit: Number of cache hitsnuxeo.cache.miss: Number of cache missnuxeo.cache.hit.ratio: Hit ratio of the cachenuxeo.cache.invalidation: Number of cache invalidationnuxeo.cache.size: Size of the cachenuxeo.cache.read: Number of cache get (miss + hit)nuxeo.cache.write: Number of cache put
Nuxeo Directories
Directory metrics have a directory dimension with the name of the directory.
Common directories are: userDirectory, groupDirectory
nuxeo.directories.directory.sessions.active: Number of active Sessionsnuxeo.directories.directory.sessions.max: Maximum number of Sessions usednuxeo.directories.directory.cache.hit: Number of entry hitsnuxeo.directories.directory.cache.hit.null: Count hit on non-existing entriesnuxeo.directories.directory.cache.invalidation: Count invalidationnuxeo.directories.directory.cache.miss: Number of cache missnuxeo.directories.directory.cache.size: Cache size
Nuxeo Elasticsearch
Nuxeo Elasticsearch service use timers.
nuxeo.elasticsearch.service.timer: Timer on the service dimension belowservice=search: Invoking an elasticsearch queryservice=scroll: Invoking a next scroll queryservice=index: Invoking indexation of a single documentservice=bulkIndex: Invoking indexation of one or more documentsservice=delete: Invoking a deletion queryservice=fetch: Fetching documents from the repository to build the search response
Nuxeo Stream Importer
When using the nuxeo-platform-importer/nuxeo-importer-stream some metrics are reported to follow producers and consumers progress.
nuxeo.importer.stream.producer: Timer on poducer hooknuxeo.importer.stream.producers: Number of producersnuxeo.importer.stream.consumers: Number of consumersnuxeo.importer.stream.consumer.committed: Number of committed documentsnuxeo.importer.stream.consumer.batchCommit: Timer on batch transaction commitnuxeo.importer.stream.consumer.batchFailure: Counter of batch failure
Nuxeo Instance UP
Each time a Nuxeo node is started it reports the following metrics that can be aggregated to count the number of Nuxeo nodes in the cluster.
nuxeo.instance-up: One if up
Nuxeo Repositories
Repository metrics have a repository dimension with the name of the repository.
nuxeo.repositories.repository.documents.create: Count the number of documents created since the node is upnuxeo.repositories.repository.documents.delete: Count the number of documents deleted since the node is upnuxeo.repositories.repository.documents.update: Count the number of documents updated since the node is upnuxeo.repositories.repository.query: Timer on NXQL queriesnuxeo.repositories.repository.save: Timer on session savesnuxeo.repositories.sessions: Counter of active sessionsnuxeo.repositories.repository.connection.count: Number of connections usednuxeo.repositories.repository.connection.idle: Number of connections idlenuxeo.repositories.repository.connection.killed: Killed connections
Repository document cache stats:
nuxeo.repositories.repository.cache.eviction.countnuxeo.repositories.repository.cache.hit.countnuxeo.repositories.repository.cache.hit.rationuxeo.repositories.repository.cache.miss.countnuxeo.repositories.repository.cache.read.countnuxeo.repositories.repository.cache.size
Repository children documents cache stats:
nuxeo.repositories.repository.childCache.eviction.countnuxeo.repositories.repository.childCache.hit.countnuxeo.repositories.repository.childCache.hit.rationuxeo.repositories.repository.childCache.miss.countnuxeo.repositories.repository.childCache.read.countnuxeo.repositories.repository.childCache.size
Nuxeo Streams
Nuxeo Stream Processor relies on a topology of computations. It is important to monitor failure because a manual intervention is required.
nuxeo.streams.failure: Total number of computation threads terminated because of failure for the node (all computations)
Each computation has the following metrics, the computation name being a dimension, for instance audit/writer, bulk/csvExport ...
nuxeo.streams.computation.failure: Count the number of computation threads terminated by a failurenuxeo.streams.computation.skippedRecord: Count the number of record skipped after failure, the computation thread is not terminatednuxeo.streams.computation.processRecord: Timer around processing of incoming recordnuxeo.streams.computation.processTimer: Timer around the computation timer processingnuxeo.streams.computation.running: Number of active computation thread processing records or timers
All these metrics are local to each Nuxeo node.
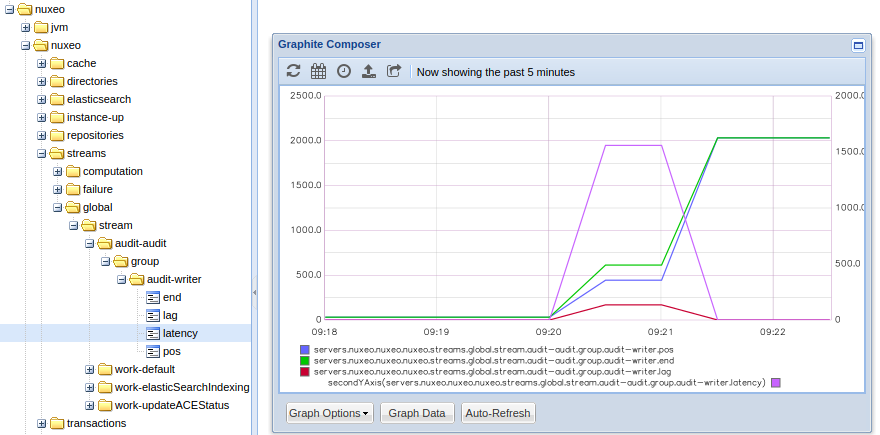
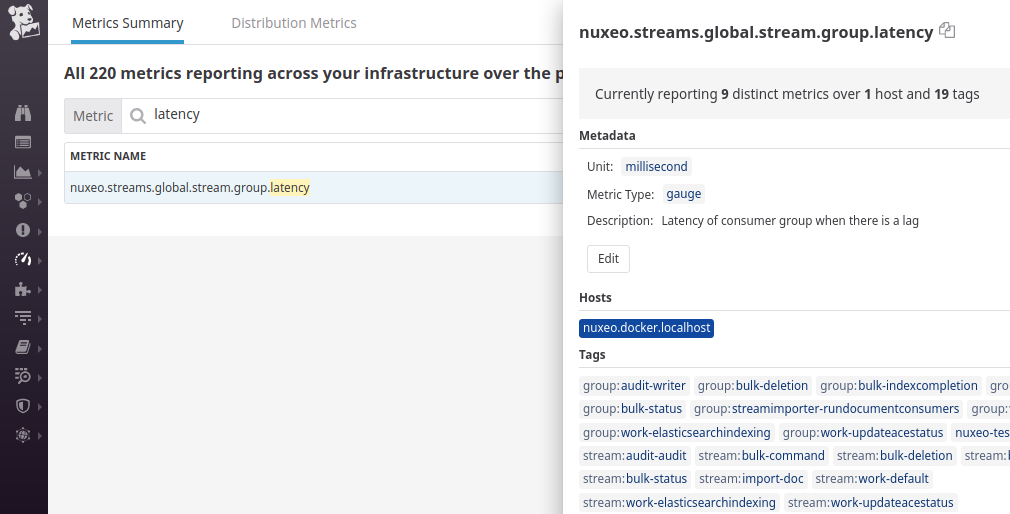
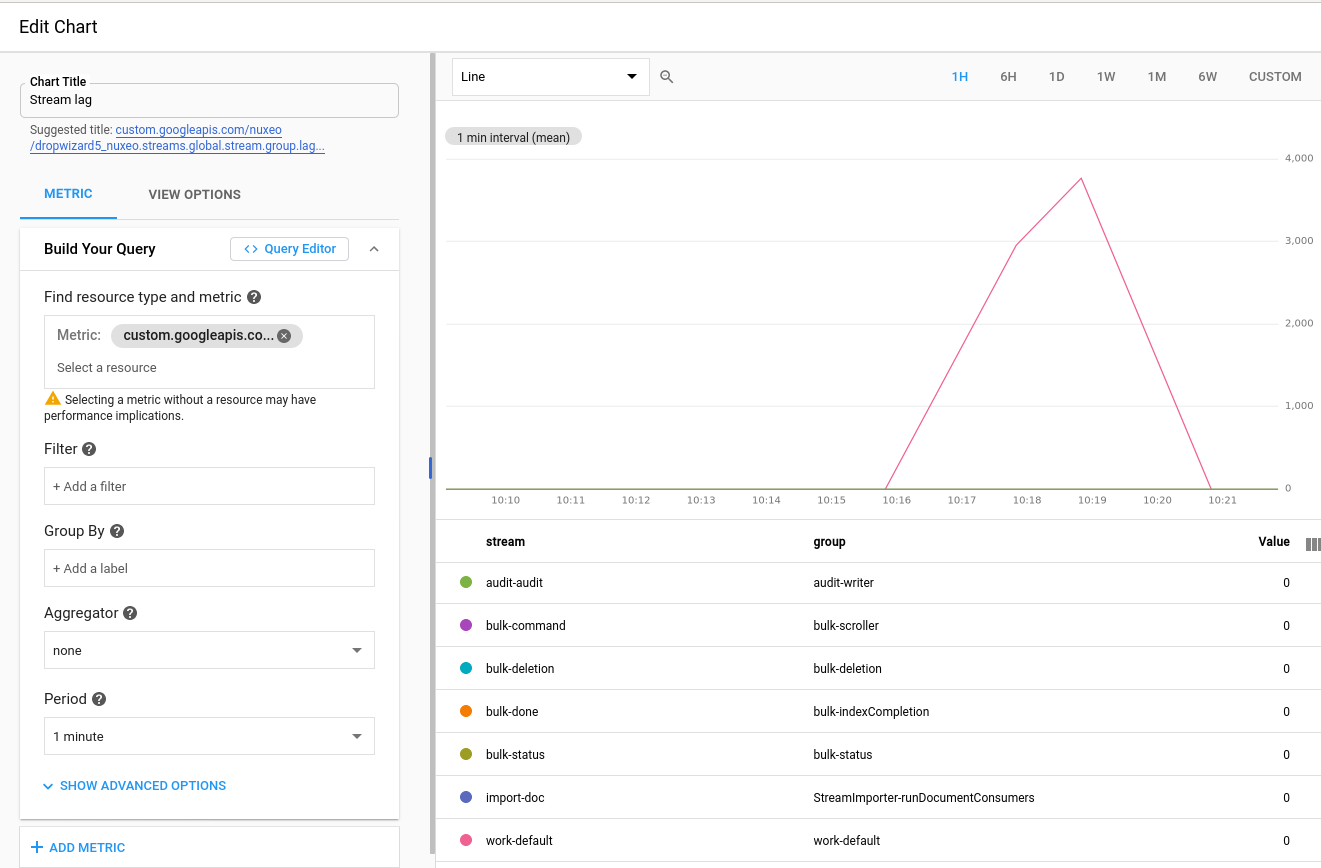
The following metrics represent the lag and latencies of computations, these metrics are global to the Nuxeo cluster and have 2 dimensions:
streamobviously the stream name likeaudit/auditorbulk/command-groupthe name of the consumer group which the computation name likeaudit/writerorbulk/scrollernuxeo.streams.global.stream.group.lag: Number of records between the end of the stream and position of the consumer groupnuxeo.streams.global.stream.group.pos: Offset of the consumer group on this streamnuxeo.streams.global.stream.group.end: Offset of the last record in the streamnuxeo.streams.global.stream.group.latency: Latency of consumer group when there is a lag
Understanding the Lag and Latency Metrics
Given a producer that appends 3 records in a stream source:
record1at timet1, offset1record2at timet2, offset2record3at timet3, offset3
A processor is started with a computation C1 reading from the previous stream,
until the first record of the stream has been processed there is no lag or latency reported.
Once the first record has been processed we have the following metrics for group: C1, stream: source:
pos: offset1end: offset3lag:2(which isend-pos)latency: now() -t1
After processing the second record we have:
pos: offset2end: offset3lag:1latency: now() -t2
After the third and last record, there is no more lag or latency, the computation has caught up with the producer:
pos: offset3end: offset3lag:0latency:0
Nuxeo Transactions
nuxeo.transactions.concurrency: Current number of concurrent transactionnuxeo.transactions.concurrency.max: Maximum registered concurrent transactionsnuxeo.transactions.rollbacks: Number of transaction rollbacksnuxeo.transactions.timer: Timer on all transactions
Nuxeo Web
Metrics reported by the Web NuxeoAuthenticationFilter:
nuxeo.web.authentication.logged-users: Number of users successfully logged and that didn't logout explicitly, the session timeout is not taken into accountnuxeo.web.authentication.requests.concurrency: Current concurrent requests in the filternuxeo.web.authentication.requests.concurrency.max: Registered maximum number of concurrencynuxeo.web.authentication.requests.timer: Timer on the request web filter
Nuxeo WorkManager
The WorkManager service provides metrics by queue (default, fulltextUpdater ...)
Some are global to the Nuxeo cluster:
nuxeo.works.global.queue.scheduled: Number of scheduled Worknuxeo.works.global.queue.completed: Number of completed Worknuxeo.works.global.queue.running: Number of running Worknuxeo.works.global.queue.canceled: number of canceled Work
Some are local to the node:
nuxeo.works.dlq: Number of Work in failure moved in the dead letter queuenuxeo.works.queue.timer: Timer for Work execution
JVM
Can be disabled using:
metrics.jvm.enabled=false
Some metrics depends on the chosen garbage collector or the version of the JVM:
jvm.buffers.direct.capacityjvm.buffers.direct.countjvm.buffers.direct.usedjvm.buffers.mapped.capacityjvm.buffers.mapped.countjvm.buffers.mapped.usedjvm.filesjvm.garbage.G1*jvm.memory.heap.committedjvm.memory.heap.initjvm.memory.heap.maxjvm.memory.heap.usagejvm.memory.heap.usedjvm.memory.non-heap.committedjvm.memory.non-heap.initjvm.memory.non-heap.maxjvm.memory.non-heap.usagejvm.memory.non-heap.usedjvm.memory.total.committedjvm.memory.total.initjvm.memory.total.maxjvm.memory.total.usedjvm.threads.blocked.countjvm.threads.countjvm.threads.daemon.countjvm.threads.deadlock.countjvm.threads.deadlocksjvm.threads.new.countjvm.threads.runnable.countjvm.threads.terminated.countjvm.threads.timed_waiting.countjvm.threads.waiting.count
Tomcat
Can be disabled using:
metrics.tomcat.enabled=false
tomcat.activeSessionstomcat.bytesReceivedtomcat.bytesSenttomcat.currentThreadBusytomcat.currentThreadCounttomcat.errorCounttomcat.jdbc-numActivetomcat.jdbc-numIdletomcat.processingTimetomcat.requestCount
Log4j
Can be disabled using:
metrics.log4j.enabled=false
org.apache.logging.log4j.core.Appender.all: Count number of log traced (all level)org.apache.logging.log4j.core.Appender.warn: Count the number of log at level WARNorg.apache.logging.log4j.core.Appender.error: Count the number of log at level ERRORorg.apache.logging.log4j.core.Appender.fatal: Count the number of log at FATAL level
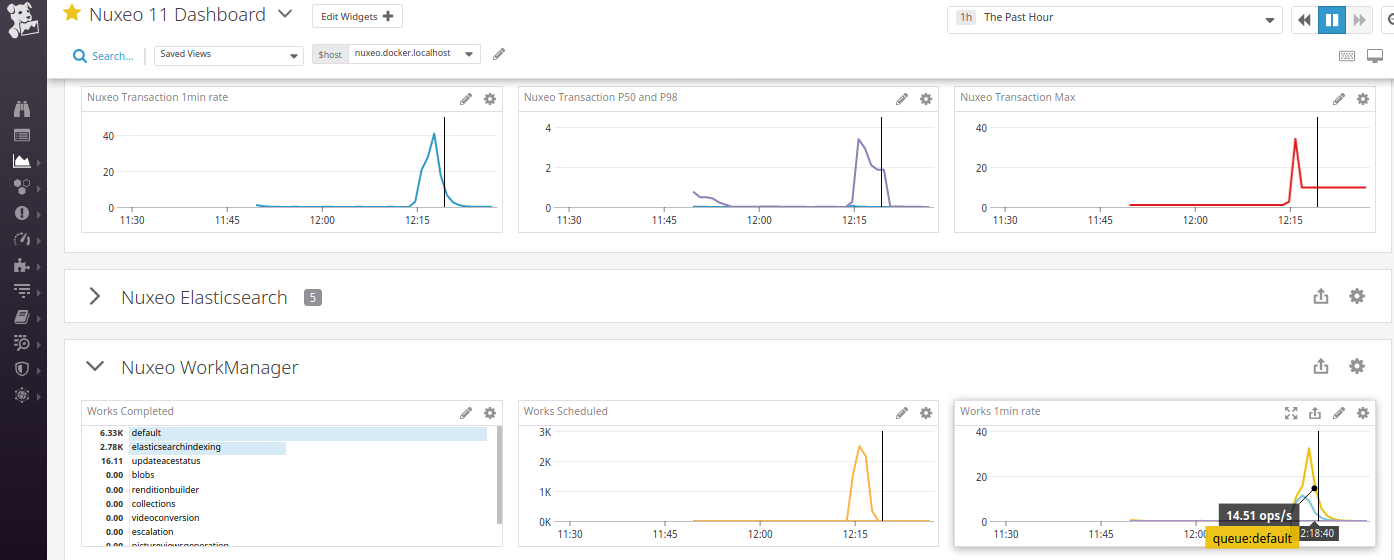
Monitoring Dashboard
The above metrics can be rendered in dashboards depending on the chosen monitoring systems.
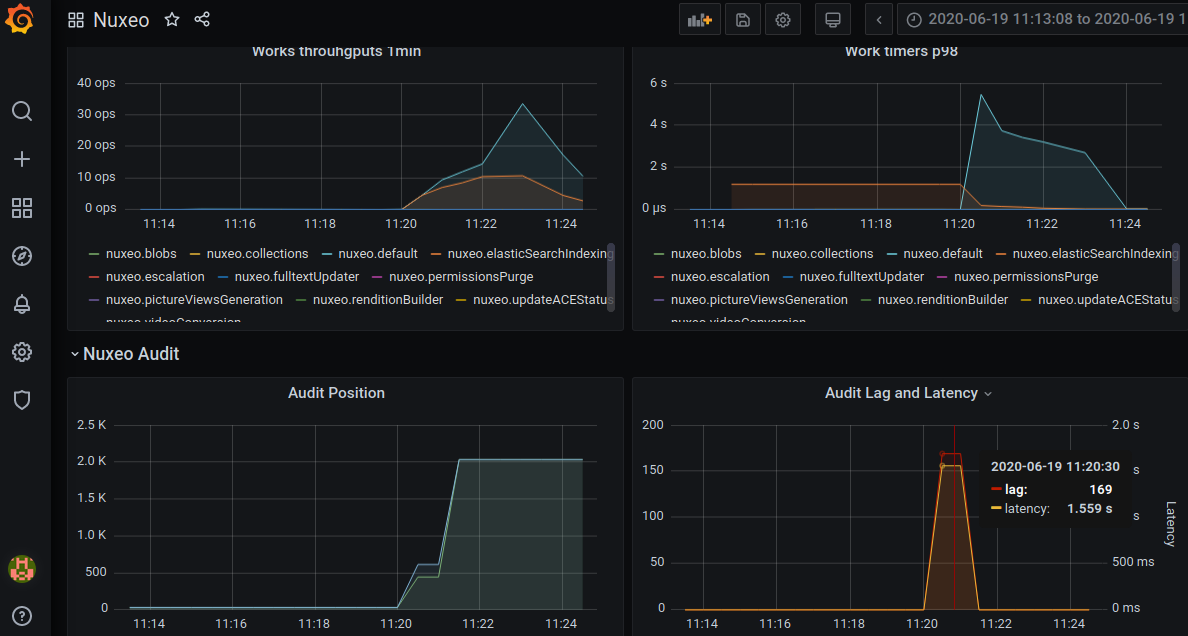
Grafana
Grafana can be used to render Graphite or Prometheus metrics.
The Nuxeo Stacks tool that generates dev and testing environment for Nuxeo provides a Grafana dashboard using a Graphite backend.
The JSON dashboard can be found in its sources.
Datadog
The same dashboard can be build using Datadog.