Like any other Java application, Nuxeo can be profiled, you will find a few useful tools in this section.
Java Flight Recorder (JFR)
Since OpenJDK version 11, it is easy to run Flight Recorder. JFR is a profiling tool used to gather diagnostics and profiling data from a running Java application.
To observe a particular load during one minute on a Nuxeo node just run:
jcmd Boot JFR.start duration=60s filename=/tmp/capture.jfr
This will produce a JFR file /tmp/capture.jfr.
You now need to install Zulu Mission Control and open the JFR file.
This is a very powerful way to report a performance problem because in addition of the profiling, the JFR file also contains a capture of the CPU activity, memory pressure, and thread dumps.
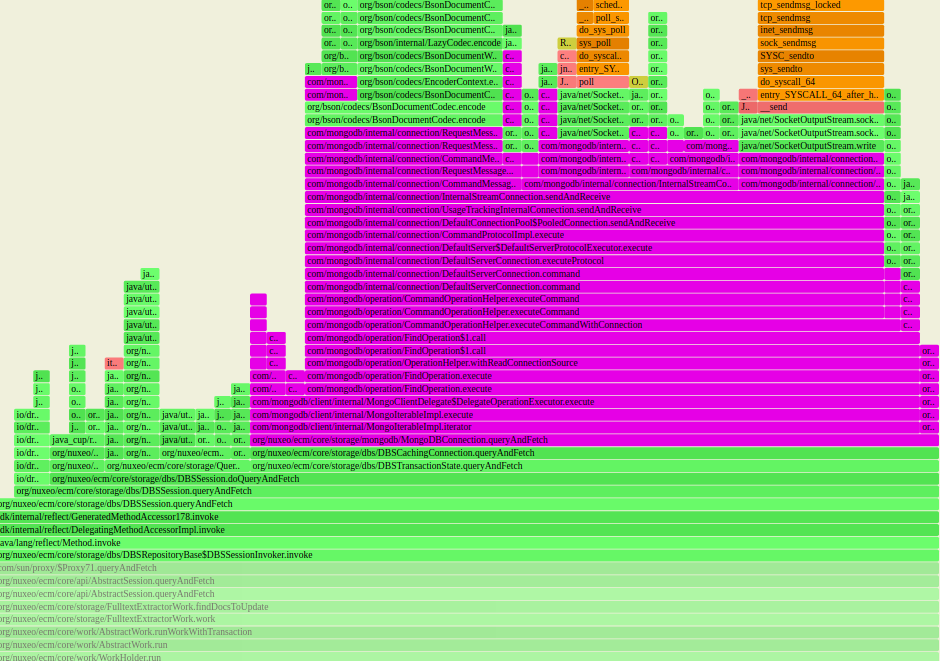
Java Flame Graph
Flame graph are a visualization of profiled software, allowing the most frequent code-paths to be identified quickly and accurately.
A typical output is an SVG that can be searched and zoomed:
First follow the documentation to install Async profiler.
Then add this to your nuxeo.conf:
JAVA_OPTS=$JAVA_OPTS -XX:+UnlockDiagnosticVMOptions -XX:+DebugNonSafepoints
Proceed to profiling with different flavors:
If you see a CPU saturation:
./profiler.sh -d 30 --title "Nuxeo CPU" -f /tmp/flame-cpu.svg jps
If there is no particular CPU saturation try:
./profiler.sh -e wall -t -d 30 --title "Nuxeo off-cpu" -f /tmp/flame-off-cpu.svg jps
Or better, filtering only interesting threads:
./profiler.sh -e wall -t -d 30 --title "Nuxeo off-cpu" -I work/* -I bulk/* -I http-nio-* -I retention/* -I audit/* -I stream/* -f /tmp/flame-off-cpu.svg jps
If you see memory pressure:
./profiler.sh -e alloc -d 30 --title '"Nuxeo Memory"' -f /tmp/flame-mem.svg jps