The Nuxeo code is instrumented using Opencensus to collect traces that are published to a tracing system.
A trace tracks the time spent by Nuxeo processing a request. Each trace consists of one or more spans. A span is a unit of work and carries key/value tags and annotations with attributes describing the work being done.
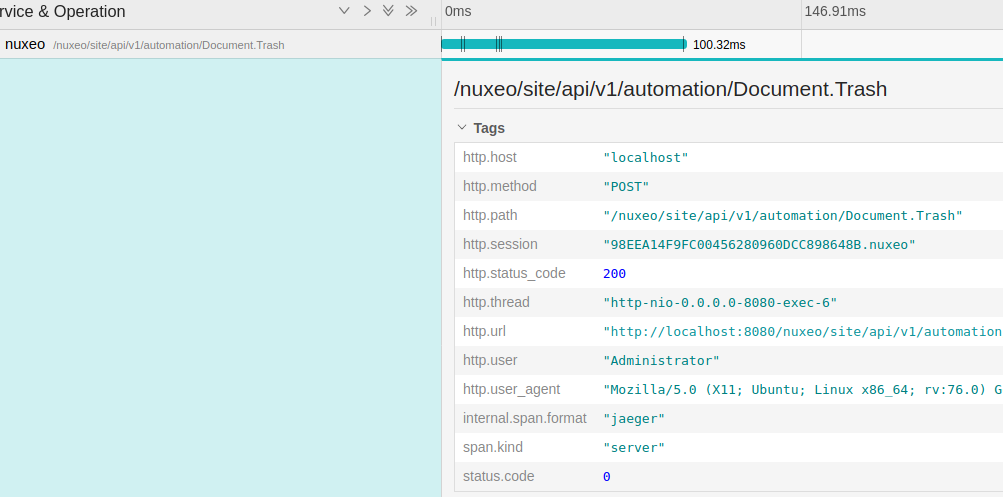
Examples of tags:
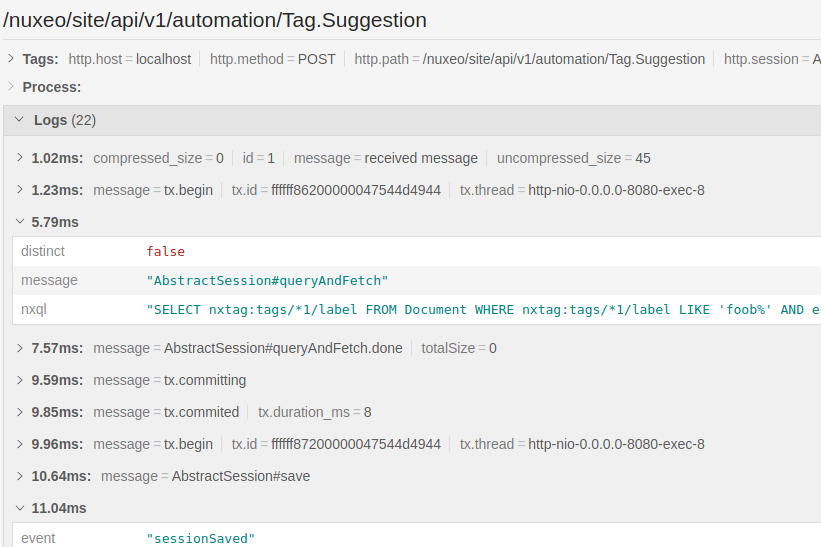
Examples of annotations (called logs in Jaeger):
The maximum number of annotations and attributes per span can be configured with the following options:
tracing.attributes.maxthe maximum number of attributes in a span, default to 128, maximum is 512tracing.annotations.maxthe maximum number of annotations in a span, default to 128, maximum is 512
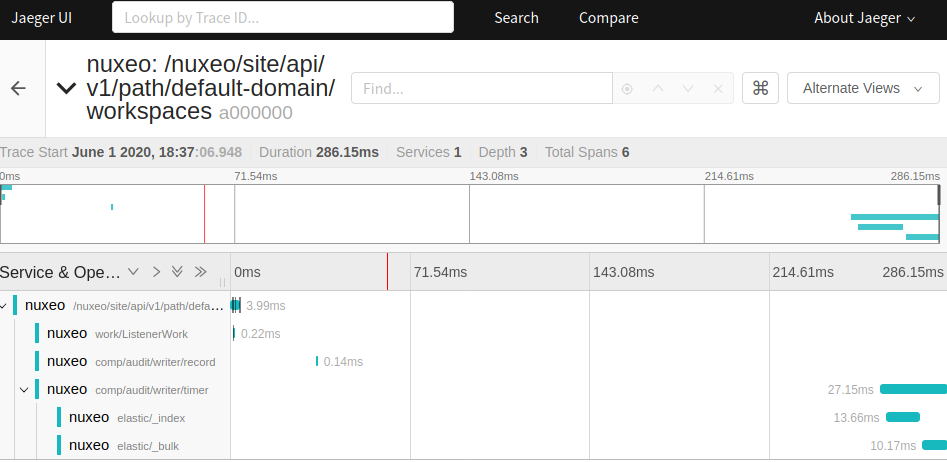
The trace context is propagated to scheduled Work or Stream processing. As a result, the trace shows all related asynchronous processing that are triggered by an HTTP request.
Supported Tracing Systems
All tracers require the activation of the metric service using:
metrics.enabled=true.
Jaeger
You need to adapt the tracing.jaeger.url for your setup:
metrics.enabled=true

tracing.jaeger.enabled=true
tracing.jaeger.url=http://jaeger:14268/api/traces
tracing.jaeger.timeout=10s
tracing.jaeger.service=nuxeo
Zipkin
You need to adapt the tracing.zipkin.url for your setup:
metrics.enabled=true

tracing.zipkin.enabled=true
tracing.zipkin.url=http://zipkin:9411/api/v2/spans
Datadog
Since Nuxeo 11.2, there is Datadog APM tracer available, you need to adapt the tracing.datadog.url for your setup:
metrics.enabled=true

tracing.datadog.enabled=true
tracing.datadog.url=http://localhost:8126/v0.3/traces
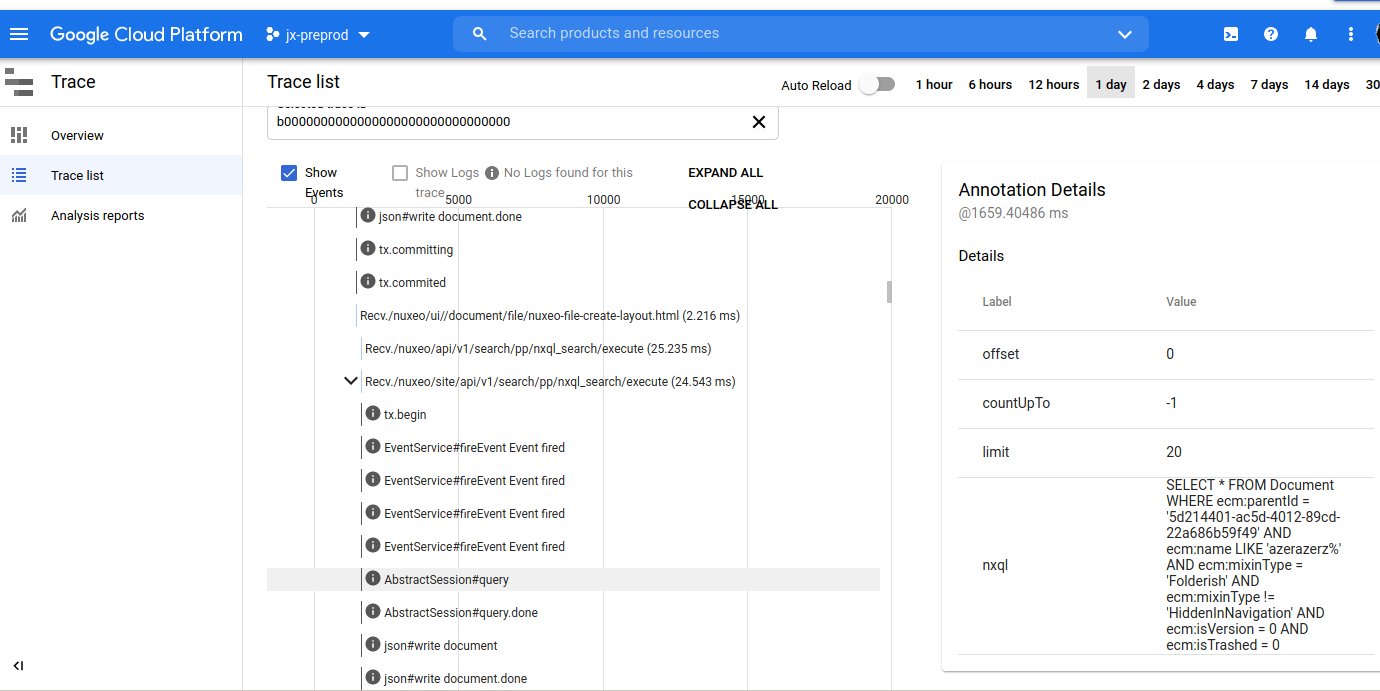
GCP Trace (Stackdriver)
You need to provide a valid GCP project identifier.
metrics.enabled=true

tracing.stackdriver.enabled=true
tracing.stackdriver.timeout=30s
tracing.stackdriver.gcpProjectId=MY-GCP-PROJECT-ID
Configuring What is Traced
Which request is traced can be determined by sampling probability using the option tracing.sampler.probability.
A value of 0 means no sampling, and a value of 1 traces all requests.
Now if you want to understand a specific action it is better to use special HTTP request header to activate tracing.
For instance using curl, we can add an explicit trace context using the standard traceparent header:
curl -XGET -H "traceparent: 00-a0000000000000000000000000000000-0000000000000001-01" "http://localhost:8080/nuxeo/site/api/v1/path/default-domain/workspaces" -u Administrator:Administrator
This means that the trace will be known as a0000000000000000000000000000000 and that the tracing must be activated (the ending -01).
If you add this custom header from your browser you will see a single trace for all the HTTP requests corresponding to your user action.
You will have to change the trace id (a00...) for each capture.
Refer to the traceparent specification for more information.